


You have the graph in your mind, but you’ll need the language to describe your knowledge graph on canvas. If you haven’t started on one yet, start with Set Up Your First Private Knowledge Graph and Invite Your Team. Since the settings are set to admin-only, you need to build the vocabulary before inviting the team members.
Vocabulary in Axy is defined by three things:
Node Types → Edge Types → Edge Statuses
This might look simple and like negotiable settings, but in practice these three lists can decide what your team can add, what the graph looks like on screen, and how easily someone can navigate the graph months or years later.
First, think beyond “setup”
Axy gives you no starting vocabulary for biology or any other field. You start with an empty list and define the terms that make sense for your field, your lab, and the way you reason about knowledge. This also means no default will cover for a rushed decision. Changing these lists is cheap while the graph is empty. Once twenty people are building against them, nothing in the graph is harder to change.
And there’s another reason to do this before inviting your team: if your graph has no Edge Types configured, contributors won’t be able to create relationships. They’ll see disabled selectors and: “No edge types configured · Go to Settings →”. But Members can’t access Settings to fix it themselves. So configuring the foundation comes first.
Throughout this guide, we’ll use the System Neuroscience graph from the earlier walkthroughs as a reference point.
On the vocabulary page
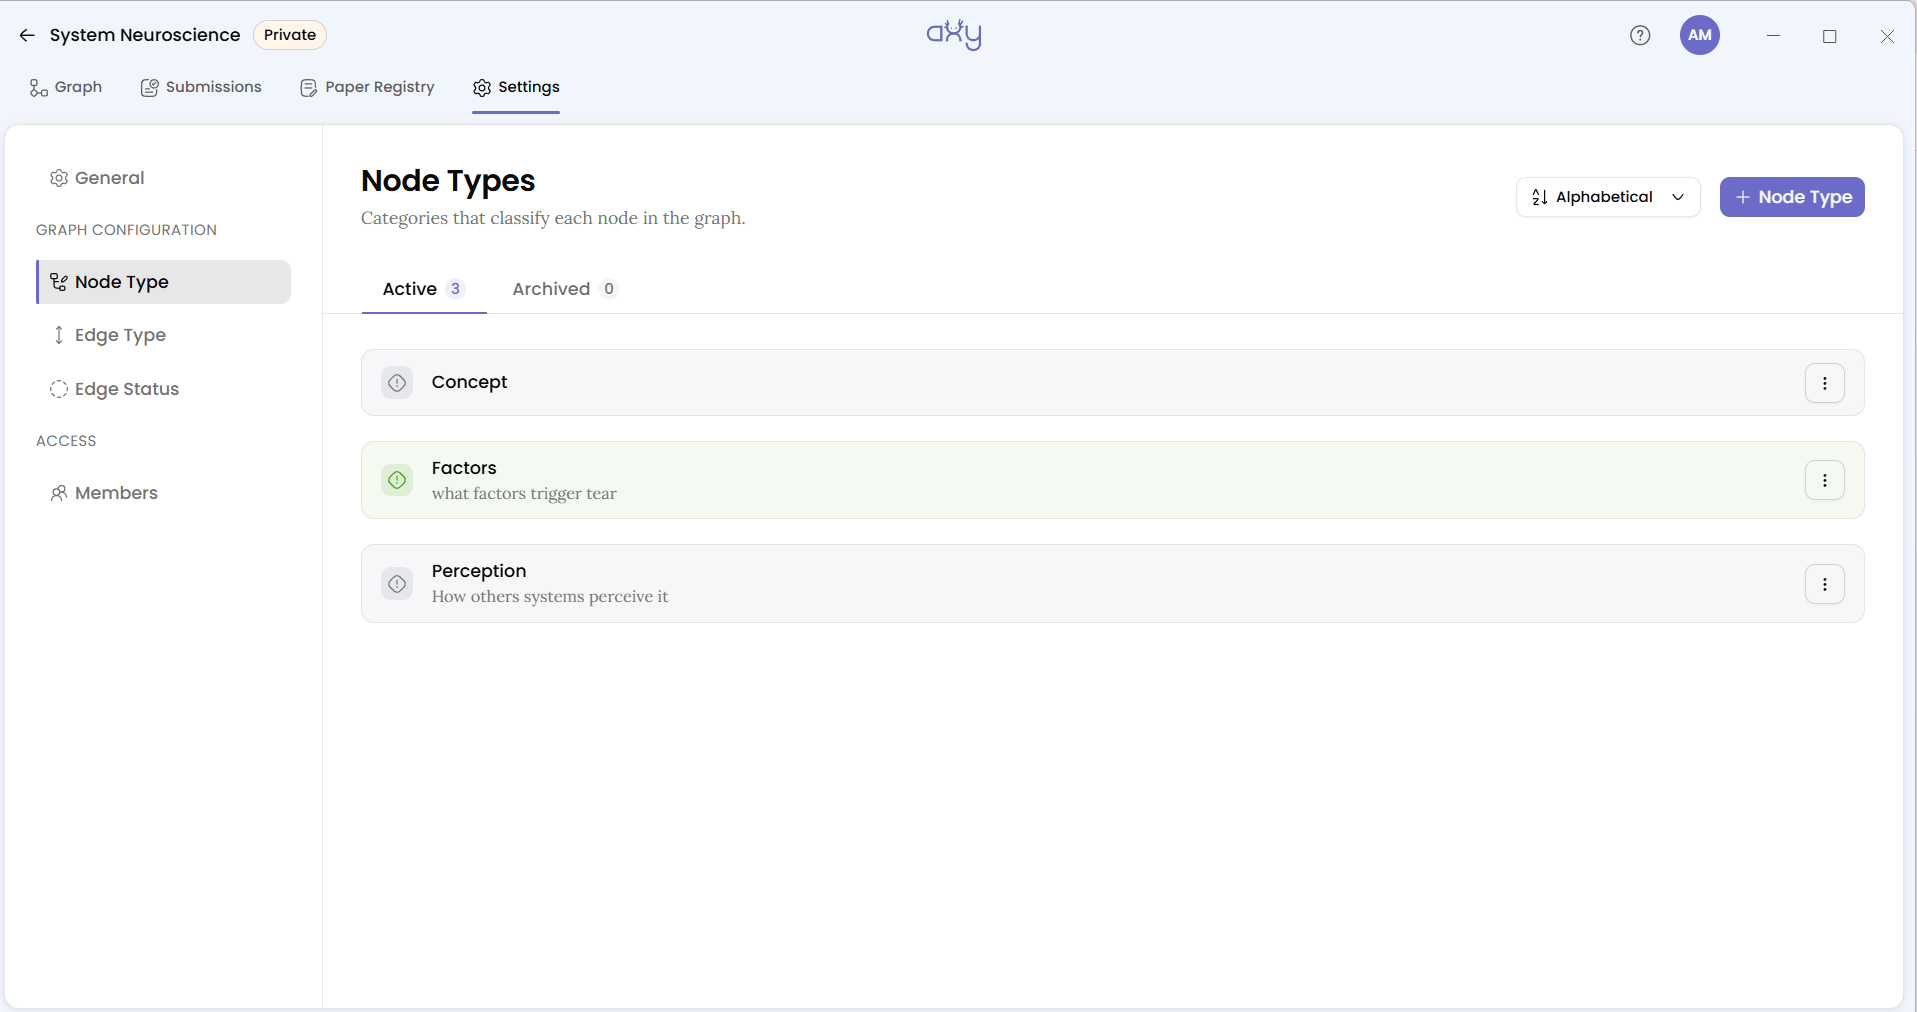
Open your graph and select Settings. The left pane lists General, then Node Type, Edge Type and Edge Status under Graph Configuration, and Members under Access. Each of the three vocabulary pages splits into an Active and an Archived tab, with a live count beside each. You can sort Node Types and Edge Types as Alphabetical or Creation Order. Edge Statuses don’t, for a reason we’ll get to.
Node types: things your graph should hold
Node Types define the kinds of things your graph can contain. Axy’s subtitle for this page is “Categories that classify each node in the graph.” Our demo graph uses three: Concept, Factors and Perception. A larger systems neuroscience graph might add types such as Neural Pathway, Physiological Process, Brain Region or Gland.
Click on the Node Type, and the Create Node Type dialog asks for four things:
- Name, up to 80 characters (the placeholder reads “Ex. Species”). Axy title-cases it as you type, which is usually what you want but can get in the way of acronyms. Tick Preserve exact casing for acronyms, gene symbols, and anything else with capitals that carry meaning.
- Description, up to 500 characters. Write the sentence a new lab member would need to pick the right type without asking you.
- Colour and Icon. Both of these settings decide the visual tone and ease of the graph on a canvas of 200 nodes.
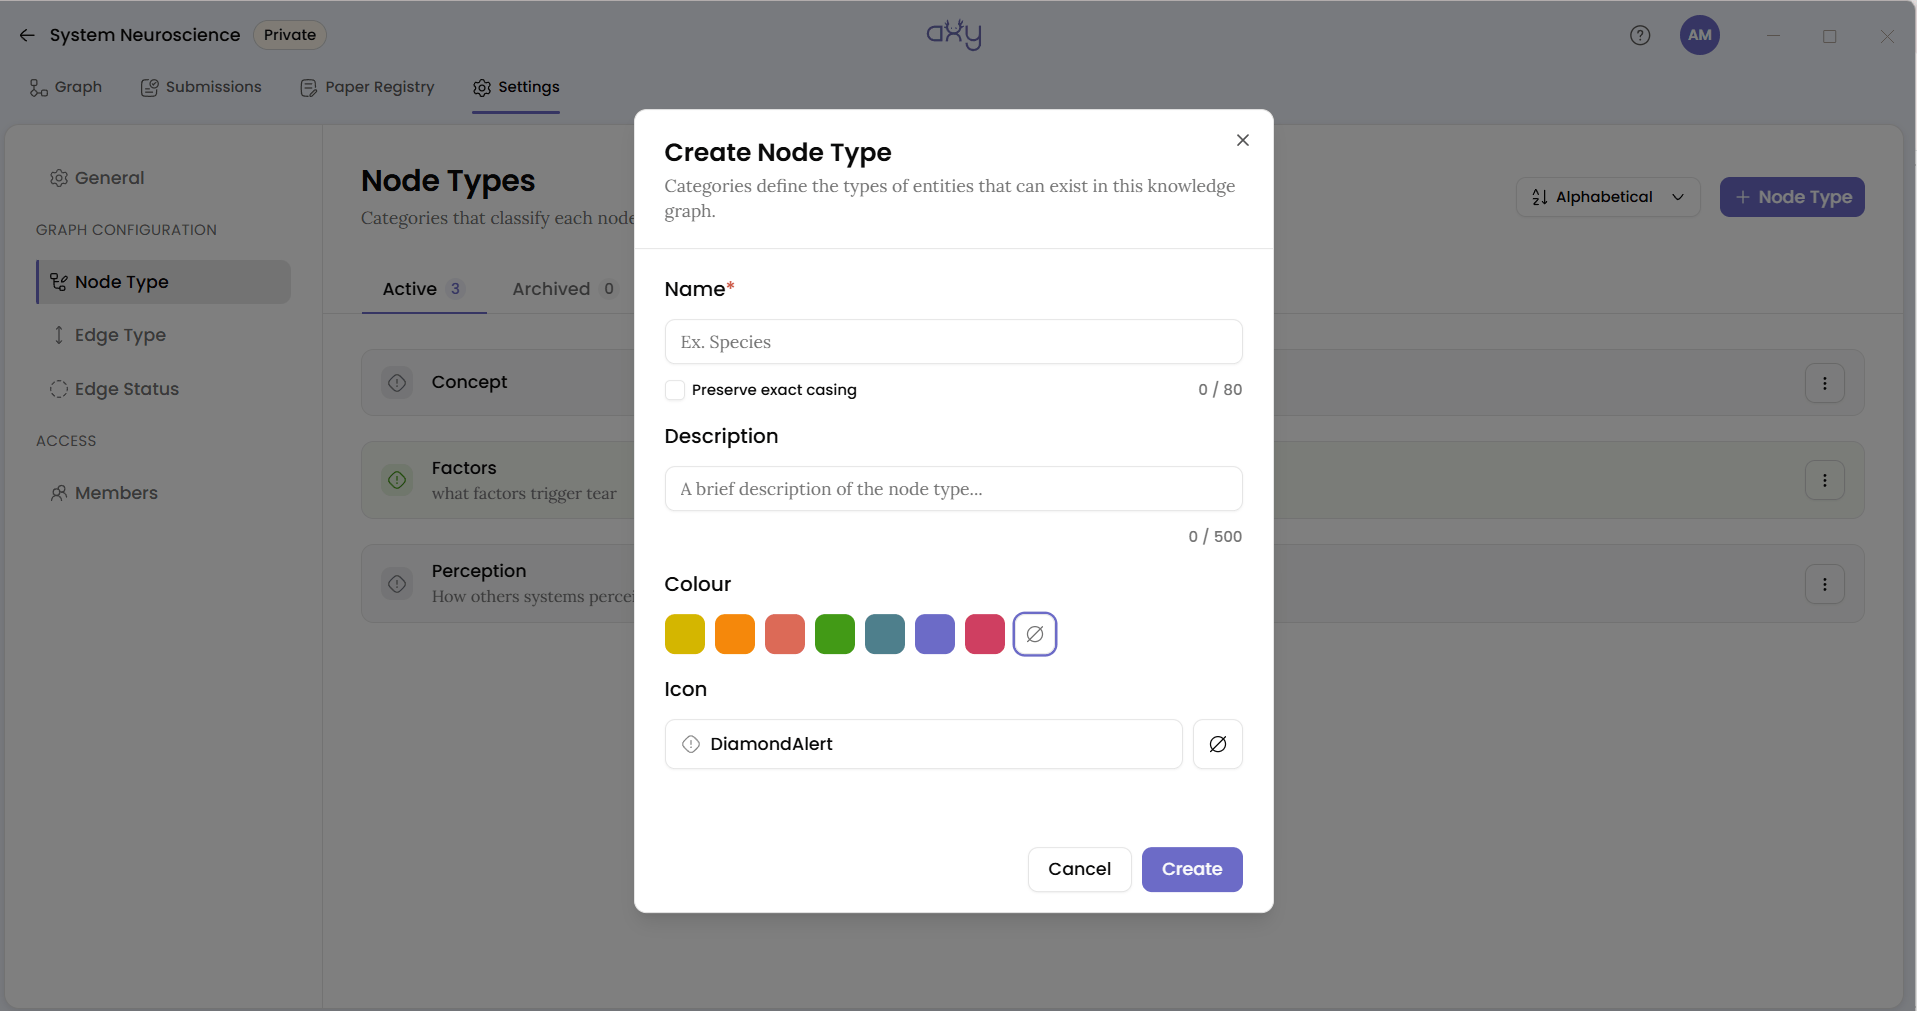

Distinct colour and icon are the only way to tell a Brain Region from a Physiological Process at a glance, and they make up the canvas legend. Choose each colour to be different from the ones next to it, and pick icons that make sense to someone who has never opened Settings.
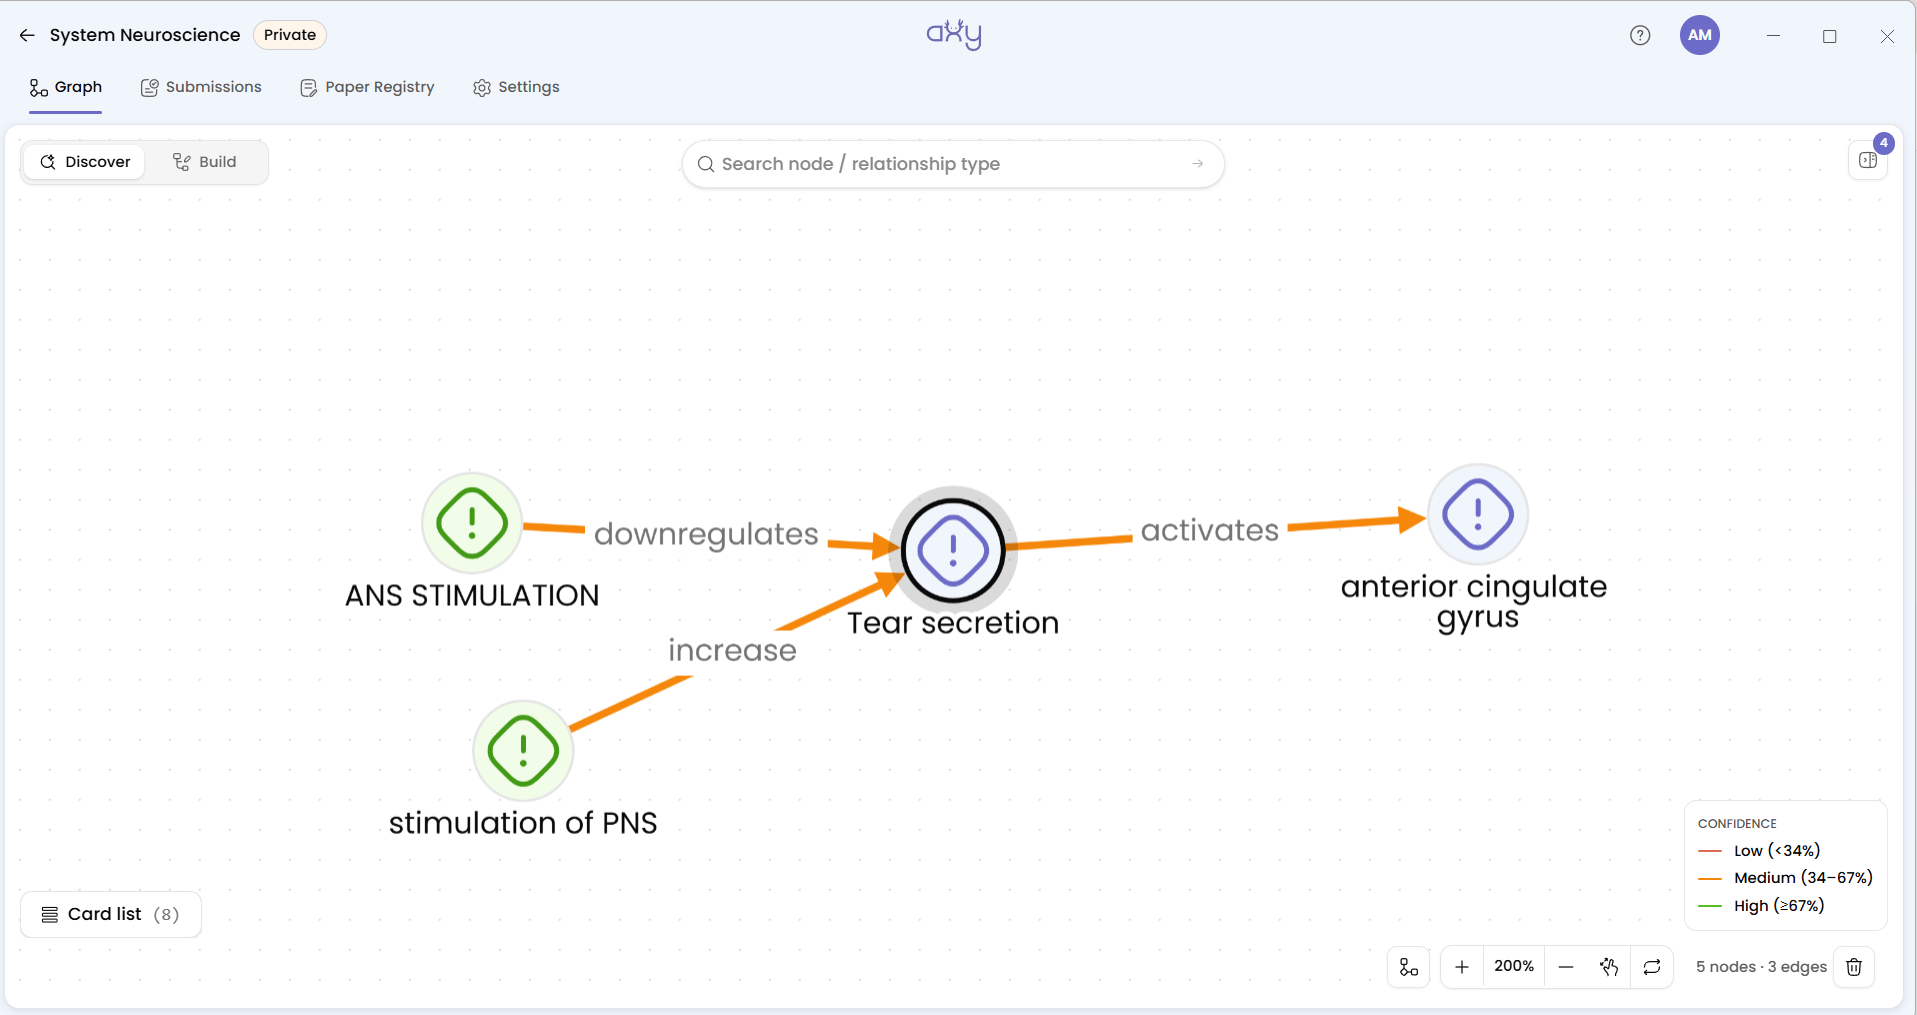
Our own demo graph shows what happens when you don’t. All three node types kept the default icon, and Concept and Perception share a colour, so on the canvas further down Tear secretion (a Concept) and anterior cingulate gyrus (a Perception) look identical. Only Factors, in green, stands apart.
Edge types: define how knowledge connects
Nodes tell you what exists. Edges tell you how those things relate.
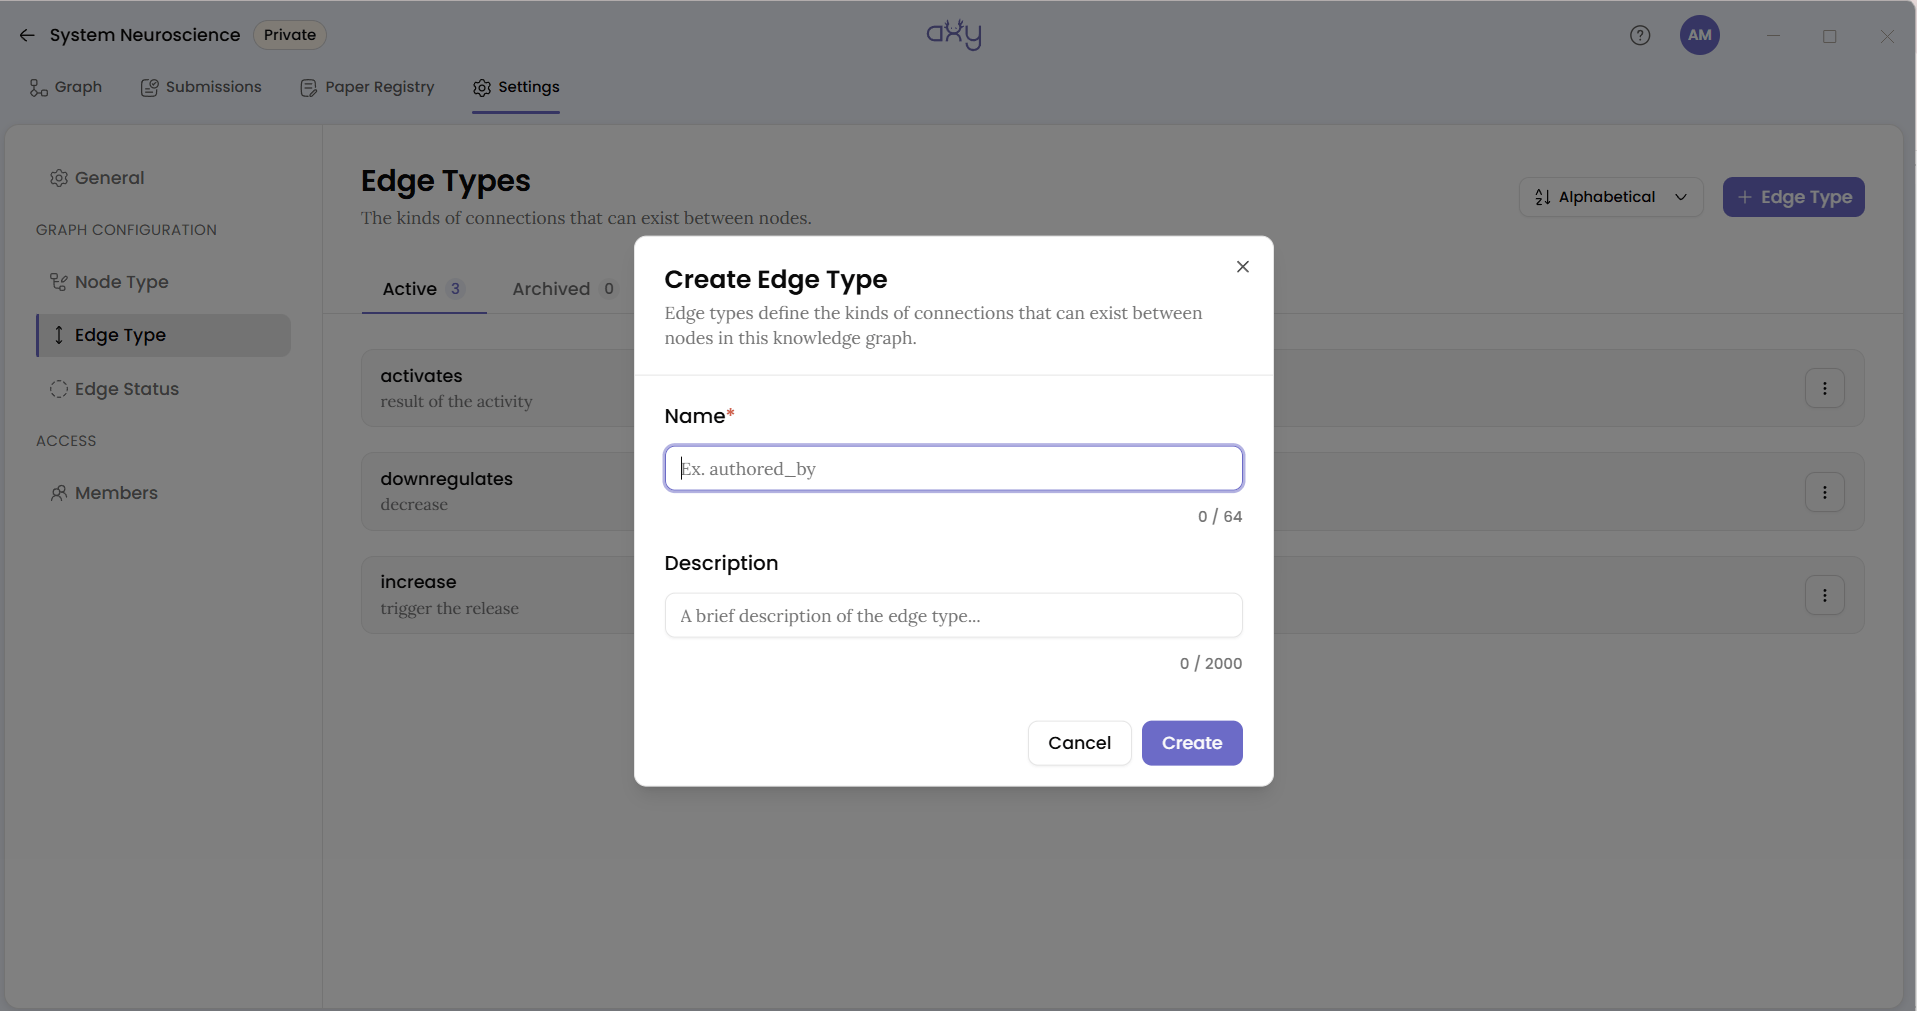
Axy’s subtitle reads it as “The kinds of connections that can exist between nodes.” The Create Edge Type dialog is shorter. It has a Name, up to 64 characters, and a Description. There’s no colour, no icon, and no automatic casing. The placeholder, “Ex. authored_by”, shows the house style: lowercase, with underscores.
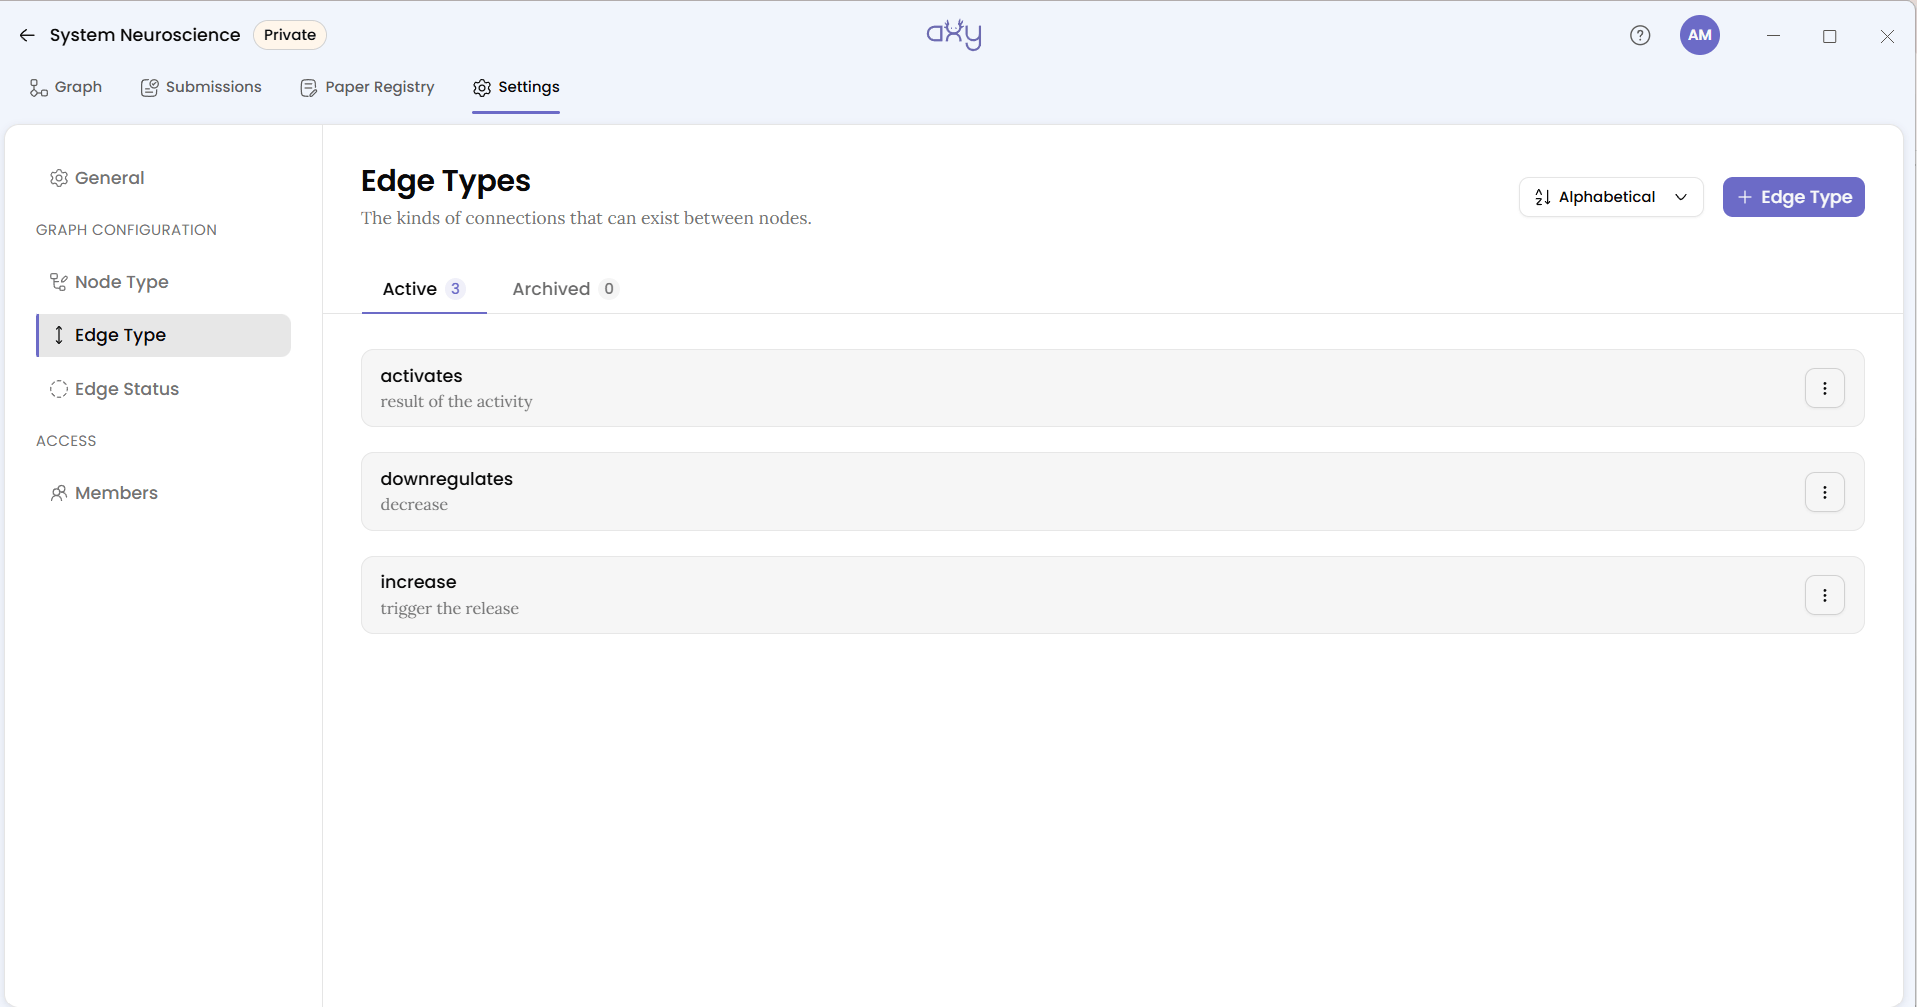
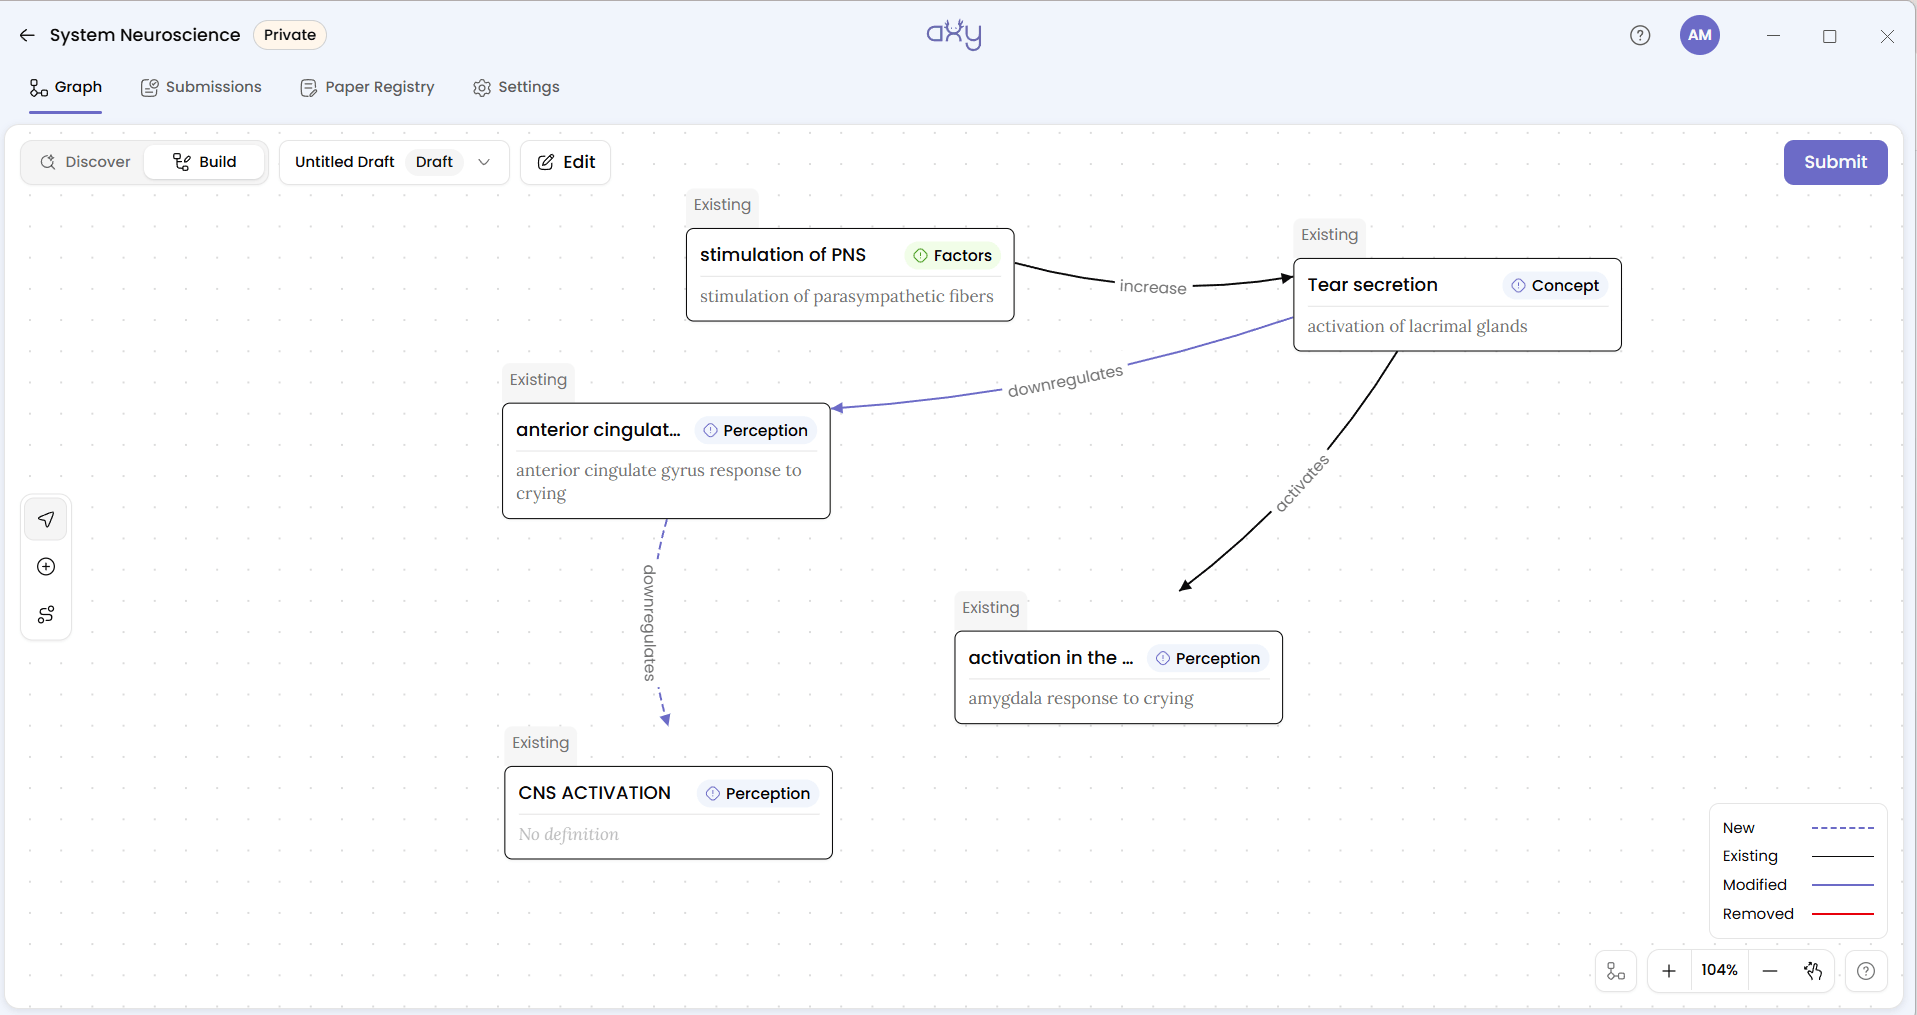
But there’s one decision that matters much more: direction. An edge reads from source to target, so its name should make a sentence in that order: stimulation of PNS increases Tear secretion. Our demo graph actually named this edge increase, which reads slightly off in that sentence; increases reads cleanly. Good edge type names are verbs that already point one way, such as activates, downregulates, inhibits and projects_to.
Avoid the “everything is related” trap. An Edge Type such as related_to may sound flexible. But flexibility can quickly become ambiguous. If an edge doesn’t tell a reviewer what relationship is actually being claimed, it’s difficult to evaluate that claim. And be careful with direction. Creating both triggers and triggered_by for the same idea can allow the same relationship to be represented in two different ways.
Pick one direction and make it your team’s convention.
Edge statuses: say how confident you are
This gives the epistemic context to the graph that most static diagrams lack.
Axy defines these as “The epistemic status of a relationship (e.g., established, hypothesized).” In simpler words, it records where your team stands on a claim and how strong the evidence behind it is. You might define a progression such as proposed, supported by one study, replicated, contested. You could also include Disputed where it makes sense for your team’s workflow.
Don’t just name the stages. Define them.
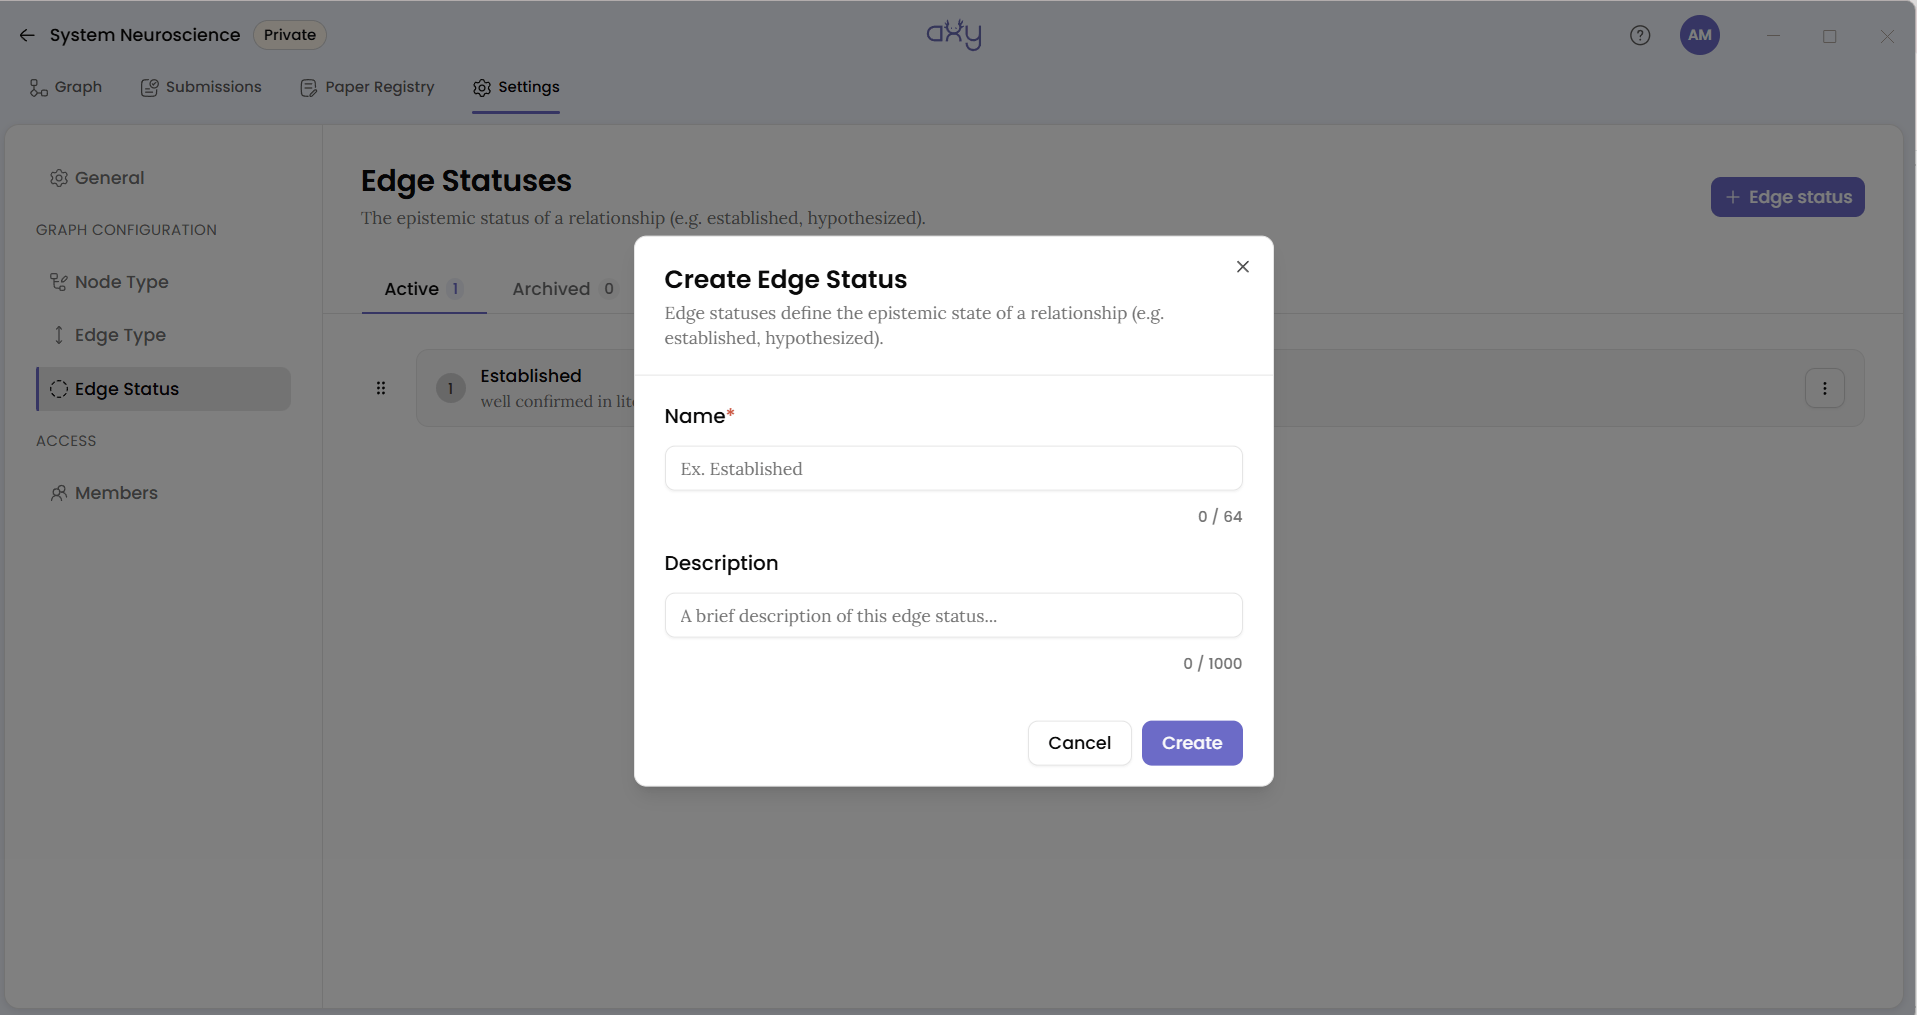
The Create Edge Status dialog takes a Name, up to 64 characters and always title-cased (the placeholder reads “Ex. Established”), and a Description. Use the description to set the bar. What evidence moves a claim from Supported to Established in your field?
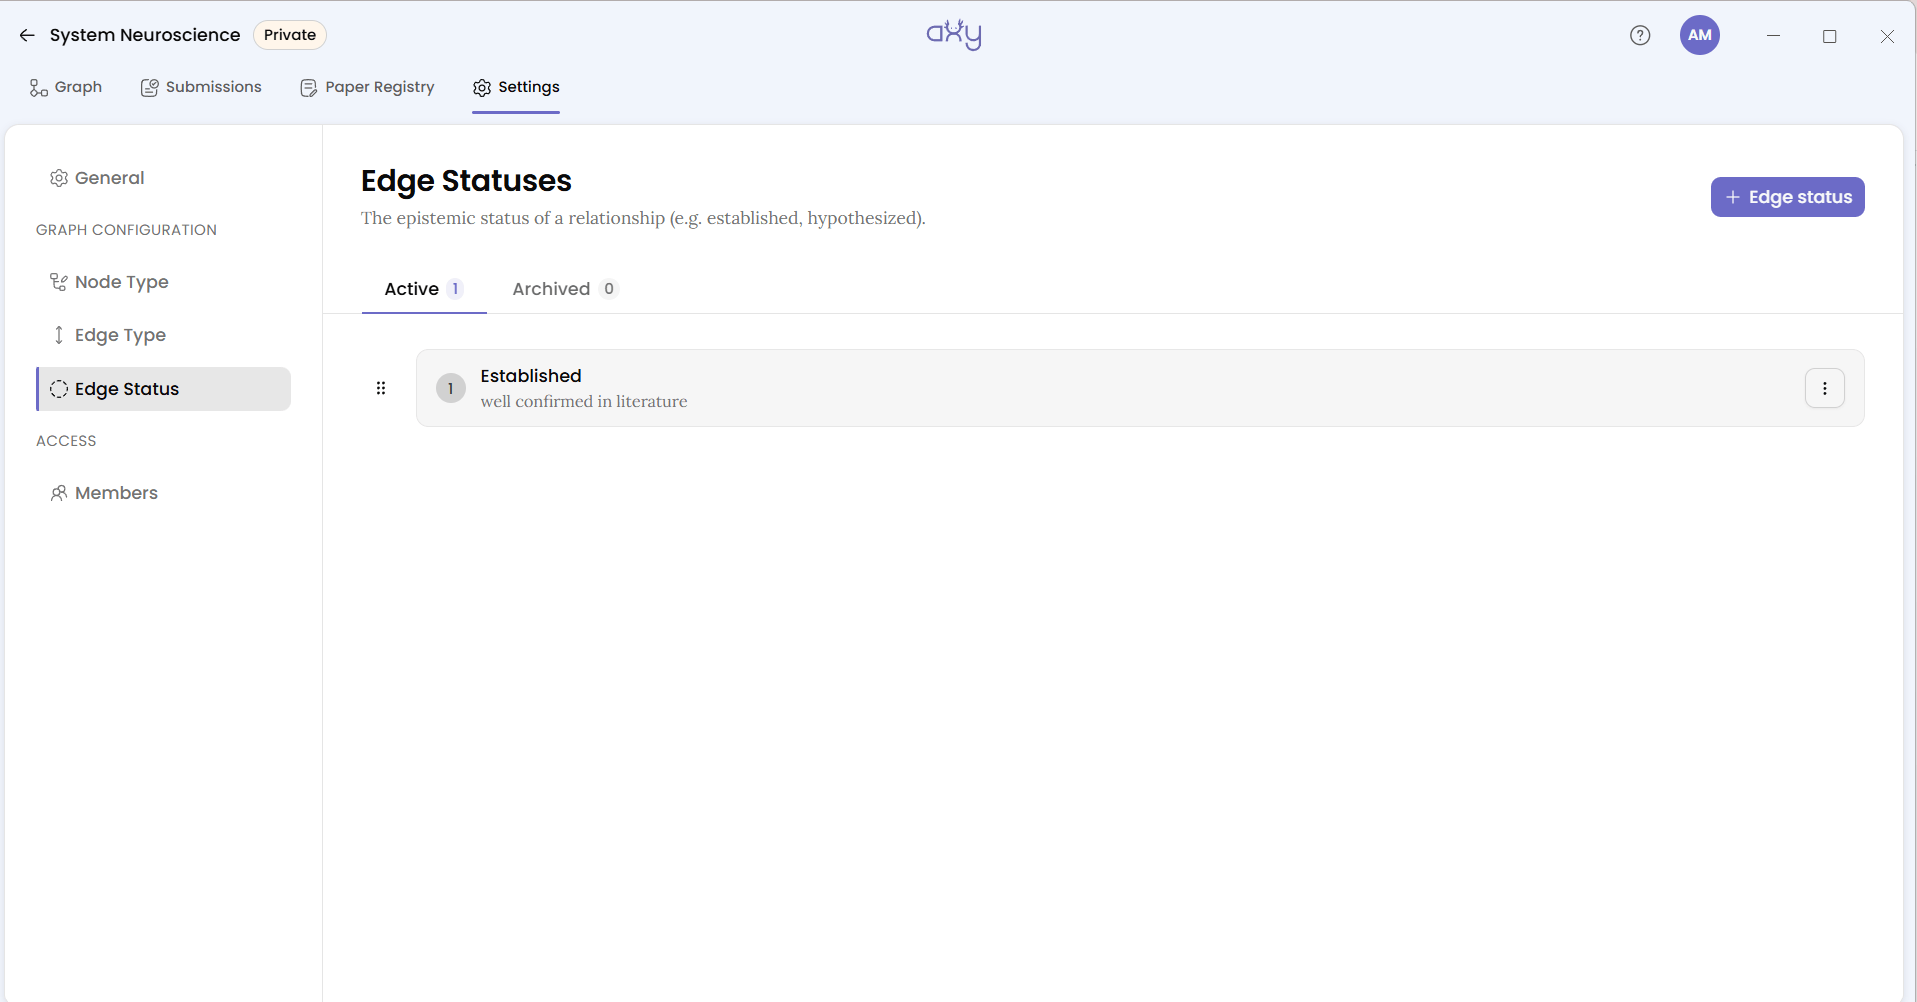
Edge Statuses are different from your other lists. They aren’t alphabetically sorted. Instead, you control their order by dragging them into position, and Axy saves that order when you drop a row.
That’s intentional.
Here’s why your three lists matter
You’ve now created three lists. But their real value appears outside Settings. In Contributions, when someone opens Add Edge, the Type and Status selectors are populated from the vocabulary you’ve defined.
Those aren’t just UI options but the language your team will use to make claims in the graph. On the Build canvas, every node carries its node type as a badge and every edge carries its edge type as its label.
On the canvas
Node colours and icons help people understand a dense graph visually. The Legends panel on the Discover canvas connects those visual cues back to your Node Types. With a well-chosen palette, you can read a dense graph at a glance; with a careless one, every node looks alike.
In search
Type into the Discover search bar (“Search node / relationship type”) and the dropdown matches nodes by name, each tagged with its node type, alongside the node types and edge types you defined in Settings. So your names become the knowledge terms people search by. Keep this in mind while editing graph vocabulary.
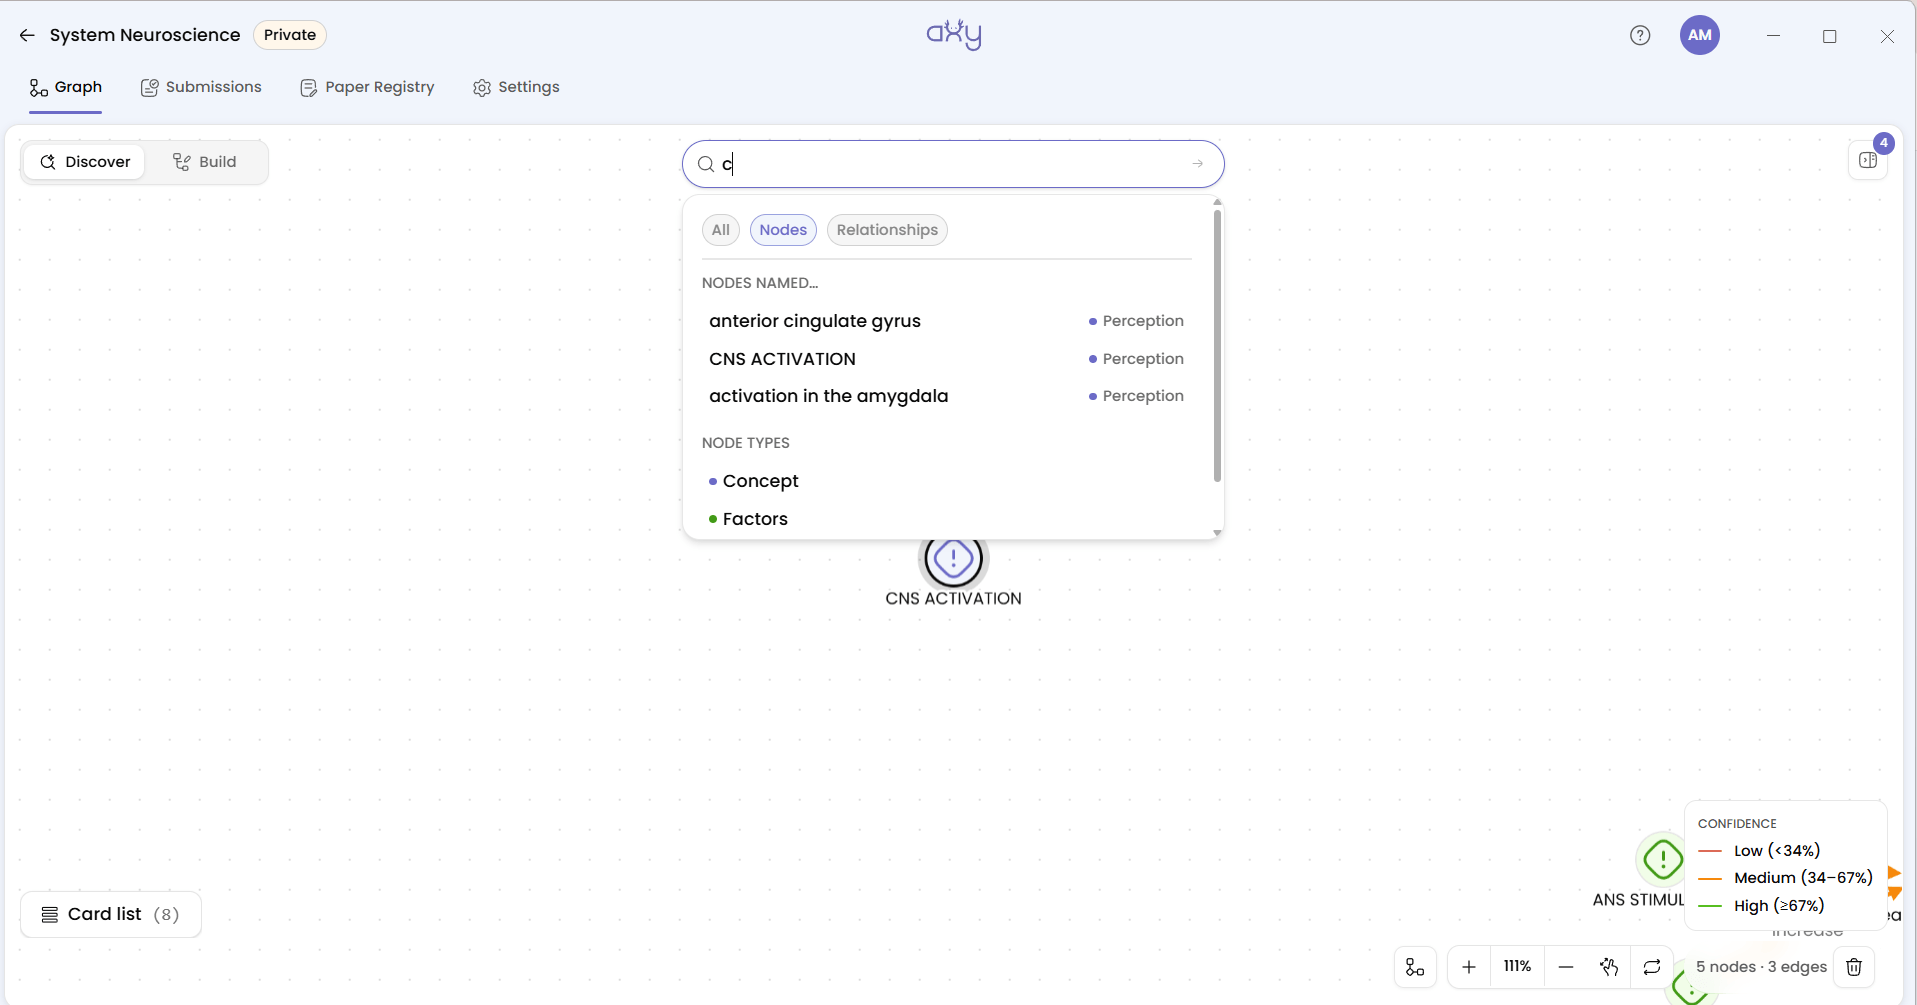
What if you wish to change?
At some point you’ll get a type wrong. Axy doesn’t delete types; it archives them, so a mistake is recoverable.
Archiving is a forward-looking change:
- The type disappears from selectors for new work.
- Existing nodes or edges keep their original type.
- Your existing graph remains intact.
- You can restore the type later from the Archived tab.
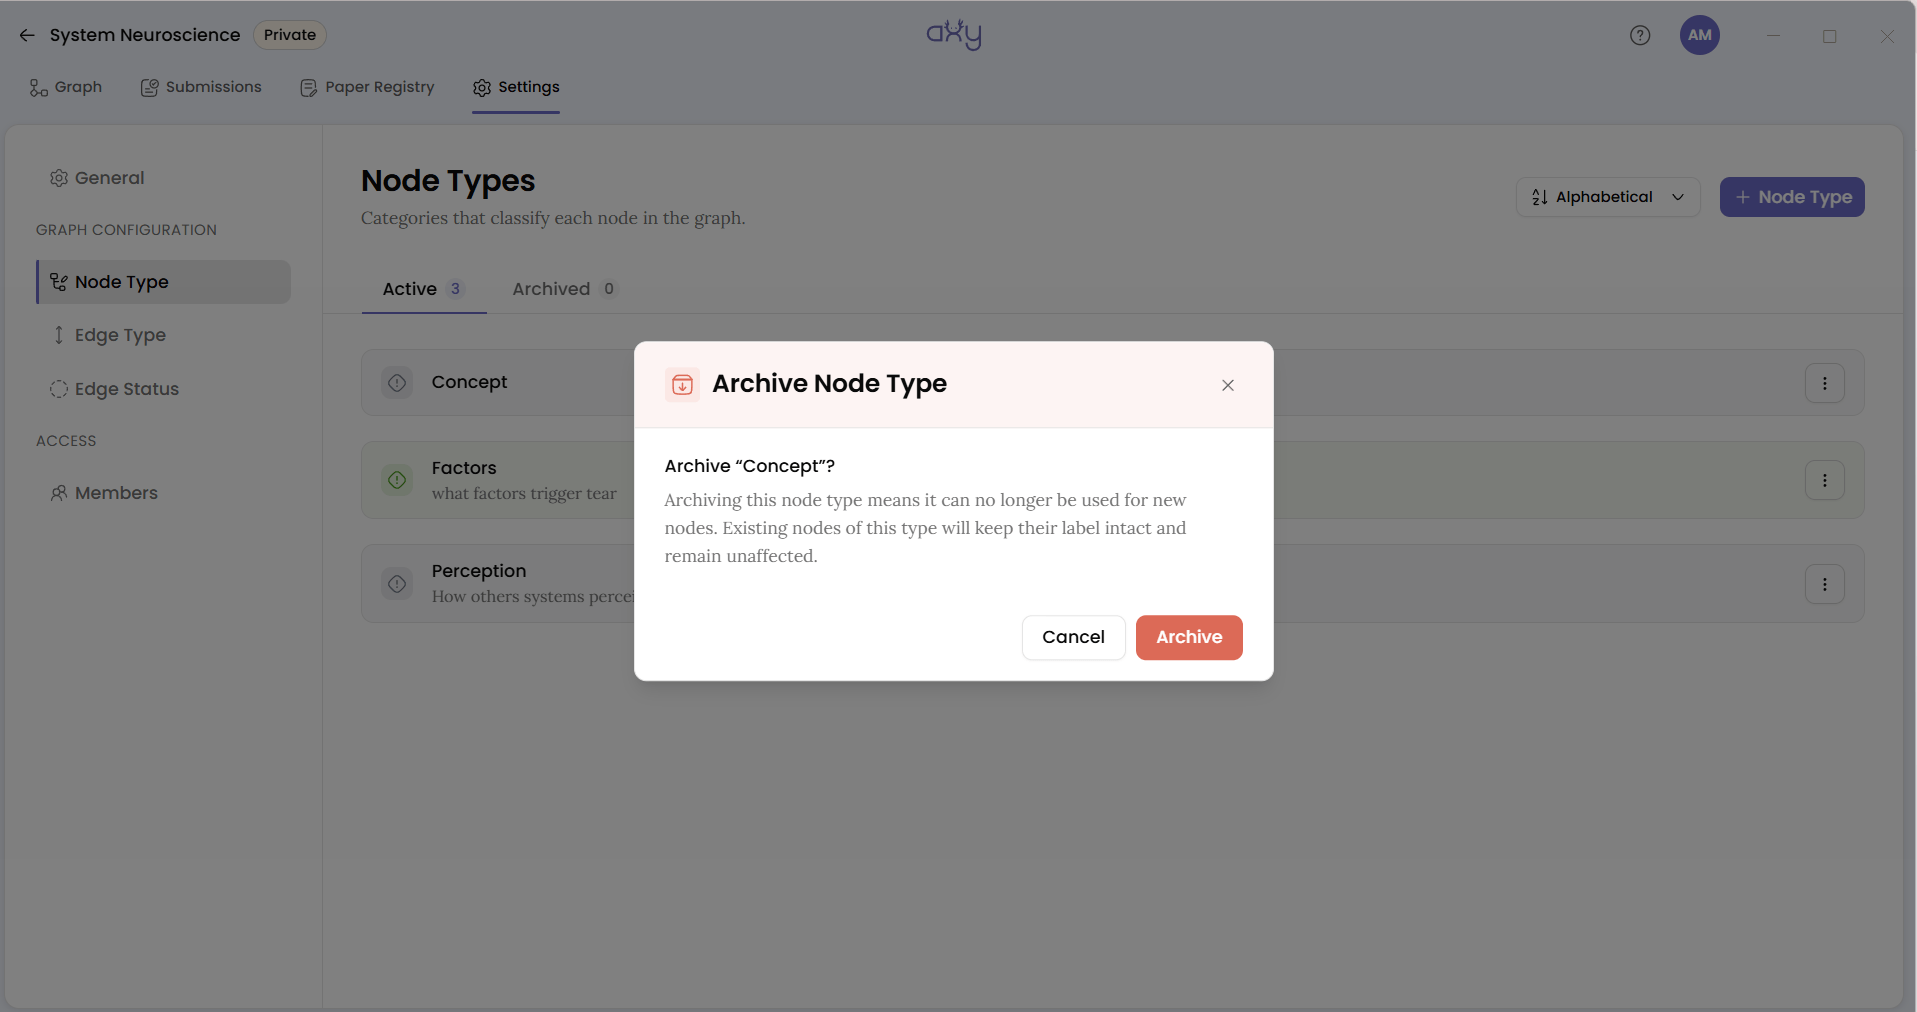
That’s an important distinction. Archive ≠ erase. It lets your vocabulary evolve without rewriting the history already captured in your graph.
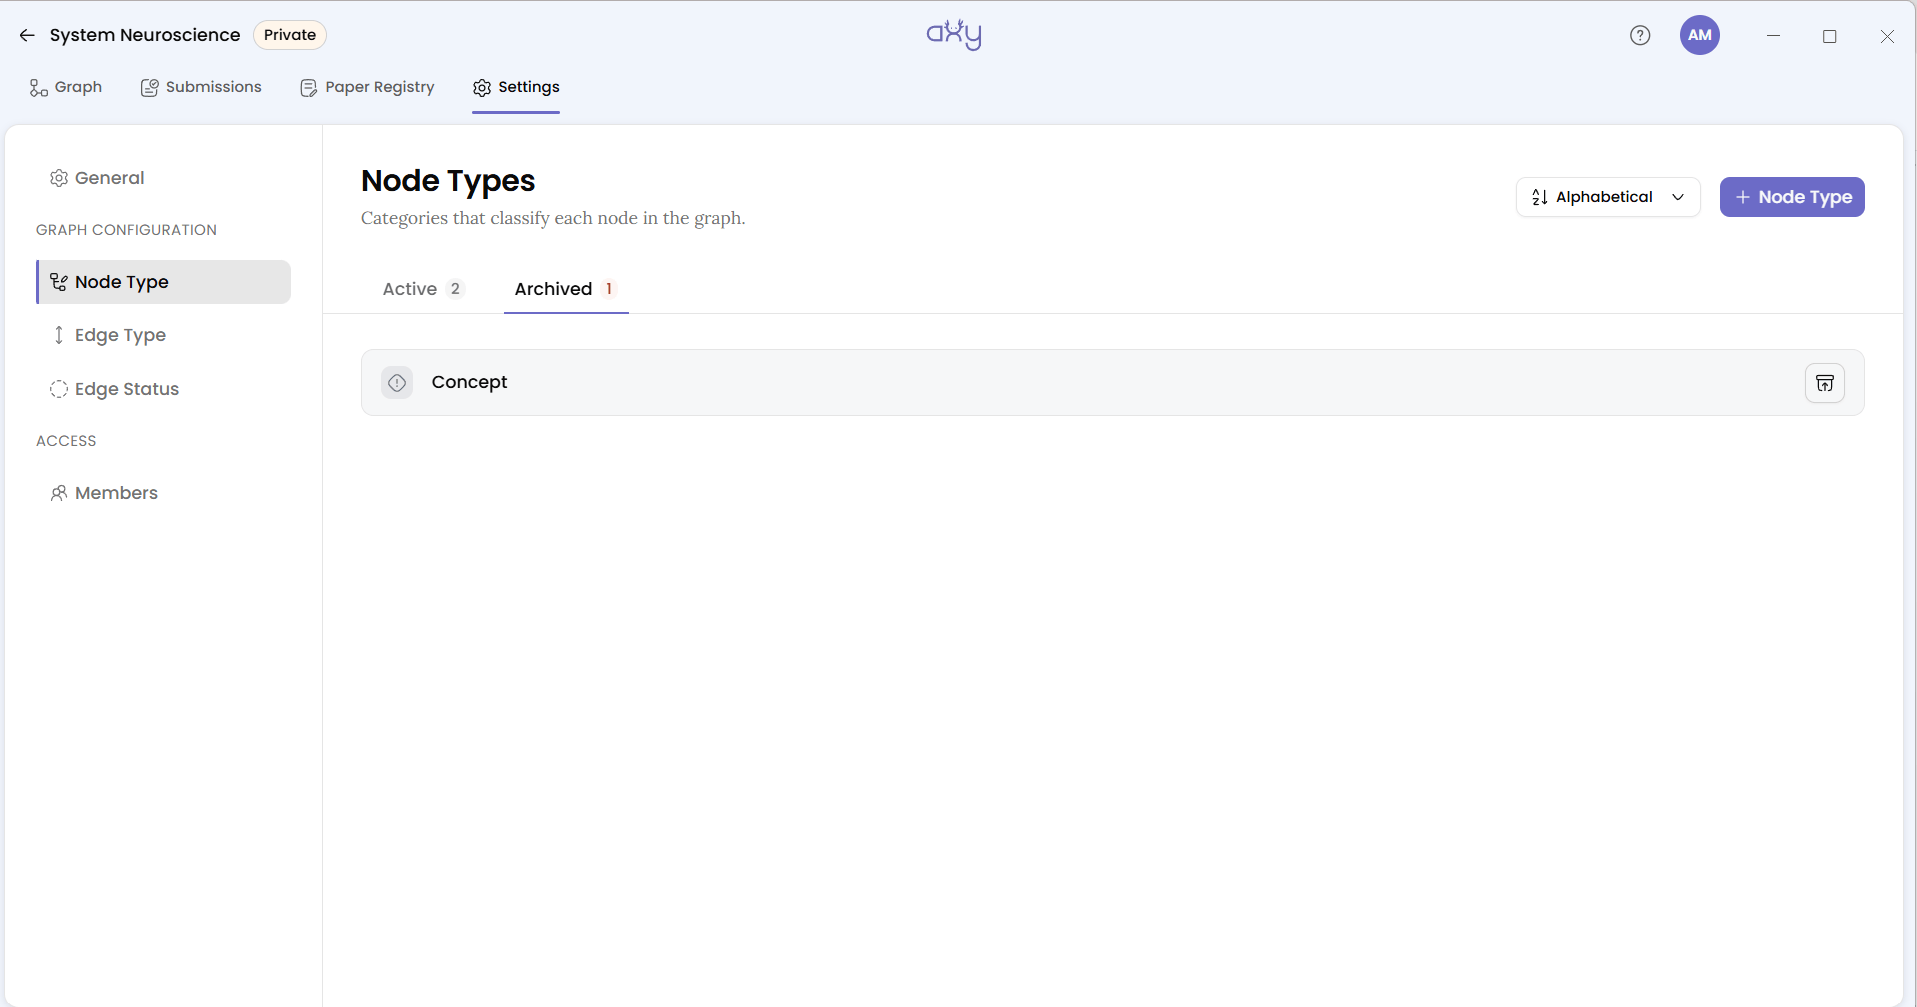
It’s a real safety net, but it doesn’t make the rework free. Archived types remain attached to existing data, so repeated changes can leave multiple versions of your vocabulary across the graph.
Give a 30-second vocabulary check
Before sending the first invite to your team, pause here.
Confirm:
- All three lists are configured, because an unconfigured graph is a dead end for the first person who arrives.
- Write every description for a stranger. It’s the only guidance a new Member gets when choosing a type.
- Start small. Five node types you’re sure of beats fifteen you’re guessing at. You can add more when a real submission needs them.
- Keep naming consistent: one convention for node type names, lowercase verbs for edge types, one direction per idea.
- Choose colours for contrast, and check them on a busy canvas rather than an empty one.
- Order edge statuses the way evidence moves in your field, and agree that order with your team.
- Archive a type that stops fitting instead of reworking it, and restore it if you were wrong.
Your graph now has a language
And that’s what makes the next step interesting.
Your team can now enter the graph and use the vocabulary you’ve defined to create structured, evidence-backed knowledge. Invite your lab members now from Settings → Members. Then make your first contribution on the graph canvas, and you’ll see the Node Types, Edge Types, and Edge Statuses you just created show up exactly where your team needs them.
'%3e%3cpath%20fill-rule='evenodd'%20clip-rule='evenodd'%20d='M120%20296L120%20280.035L120%20189.742L120%20120L356.293%20120H429.082L470%20120L470%20296L325.583%20296C298.92%20308.779%20268.624%20316%20236.5%20316C204.376%20316%20174.08%20308.779%20147.417%20296L120%20296Z'%20fill='%23B6C1EB'/%3e%3c/g%3e%3cg%20id='Ellipse%20142'%20filter='url(%23filter1_f_0_8)'%3e%3cpath%20fill-rule='evenodd'%20clip-rule='evenodd'%20d='M147.417%20296C137.774%20291.379%20128.607%20286.031%20120%20280.035L120%20189.742L120%20120L356.293%20120L429.082%20120C429.689%20125.758%20430%20131.595%20430%20137.5C430%20206.449%20387.622%20266.268%20325.584%20296C298.92%20308.779%20268.624%20316%20236.5%20316C204.376%20316%20174.08%20308.779%20147.417%20296Z'%20fill='%23FFFFE6'/%3e%3c/g%3e%3cg%20id='Ellipse%20143'%20filter='url(%23filter2_f_0_8)'%3e%3cpath%20fill-rule='evenodd'%20clip-rule='evenodd'%20d='M120%20189.742C141.632%20225.693%20183.01%20250%20230.5%20250C300.364%20250%20357%20197.394%20357%20132.5C357%20128.278%20356.76%20124.107%20356.293%20120L120%20120L120%20189.742Z'%20fill='white'/%3e%3c/g%3e%3c/g%3e%3cdefs%3e%3cfilter%20id='filter0_f_0_8'%20x='-6.38111e-08'%20y='4.01978e-08'%20width='590'%20height='436'%20filterUnits='userSpaceOnUse'%20color-interpolation-filters='sRGB'%3e%3cfeFlood%20flood-opacity='0'%20result='BackgroundImageFix'/%3e%3cfeBlend%20mode='normal'%20in='SourceGraphic'%20in2='BackgroundImageFix'%20result='shape'/%3e%3cfeGaussianBlur%20stdDeviation='60'%20result='effect1_foregroundBlur_0_8'/%3e%3c/filter%3e%3cfilter%20id='filter1_f_0_8'%20x='20'%20y='20.0001'%20width='510'%20height='396'%20filterUnits='userSpaceOnUse'%20color-interpolation-filters='sRGB'%3e%3cfeFlood%20flood-opacity='0'%20result='BackgroundImageFix'/%3e%3cfeBlend%20mode='normal'%20in='SourceGraphic'%20in2='BackgroundImageFix'%20result='shape'/%3e%3cfeGaussianBlur%20stdDeviation='50'%20result='effect1_foregroundBlur_0_8'/%3e%3c/filter%3e%3cfilter%20id='filter2_f_0_8'%20x='20'%20y='20.0002'%20width='437'%20height='330'%20filterUnits='userSpaceOnUse'%20color-interpolation-filters='sRGB'%3e%3cfeFlood%20flood-opacity='0'%20result='BackgroundImageFix'/%3e%3cfeBlend%20mode='normal'%20in='SourceGraphic'%20in2='BackgroundImageFix'%20result='shape'/%3e%3cfeGaussianBlur%20stdDeviation='50'%20result='effect1_foregroundBlur_0_8'/%3e%3c/filter%3e%3c/defs%3e%3c/svg%3e)


