


If you’ve ever tried to map literature for a group review, you’ll recognise the scene: sixty-odd papers, and everyone reading their assigned ones and adding notes to a shared spreadsheet. The columns are author, year, method, findings, and the one that always ends up empty: connections.
A literature map should help answer how these findings relate to one another. Since a literature map can mean two different things, choosing the right kind matters when your group needs to present a coherent picture of the evidence.
Two maps, one name
A citation map has papers as its nodes and citations as the links between them. Start with one paper, and tools such as Litmaps, Connected Papers, and ResearchRabbit can help you explore what it cites, what cites it, and which papers sit nearby in the literature.
A findings map starts somewhere else. Fig 2.1 of Creswell & Creswell’s Research Design illustrates one in its literature-review chapter. Instead of making papers the nodes, it maps the concepts that researchers study. The links are what the papers found out about how those concepts relate, such as A increases B, C has no effect on D, E only matters when F is present.
The distinction between the two maps matters.
A citation map tells you where to read next. A findings map helps researchers with what the field currently knows. When your group presents, the audience doesn’t want to hear who cited whom. They want to know where findings agree, where they contradict one another, and where the evidence is still limited. That’s what a findings map is designed to make visible.
In this guide, we’ll walk through how a group of two to six researchers can build a findings map together in Axy: every finding tied to its paper’s DOI, every finding checked by a second member before it goes in, and a map that’s still there after the deadline.
Find the papers first. Map the findings next.
Start with the tools your group already uses. Keep Zotero, Mendeley, or whatever reference manager your group shares to store them. Axy doesn’t search the literature or hold PDFs. This workflow begins when your group already has its reading list and wishes to connect what those papers found.
Set up one shared knowledge graph
Choose one person to Admin the graph and create a knowledge graph in Axy. For a graph based on published research, a public graph is the simplest way to get started.
Everyone who has downloaded and signed in to Axy can draft, submit, review, and comment on a public graph without being added as a member. Only admins can merge submissions, so the graph Admin retains control over what becomes part of the graph. The Free plan includes one public graph, and Axy’s pricing page says outside contributors “are never seats and they never cost you anything.” This makes it a practical option for student projects, collaborative literature reviews, and research groups working towards a poster or presentation.
The trade-off here is that any signed-in Axy user can find a public graph. Keep unpublished results and confidential research out of it. If your graph requires privacy, you can invite members; Axy lists this under the Pro plan at $5 per person per month.
Give the graph a name that reflects the research area or question you’re investigating. Our demo graph is called System Neuroscience. A question works too, e.g. Lit map: what drives emotional tear secretion?
Agree on the vocabulary before anyone adds a finding
It’s the most important hour of the knowledge graph, and it can save your group considerable work later.
While merging a group’s literature matrix, three people read the same finding and write it three ways: “PNS stimulation raises tear output”, “parasympathetic activity ↑ lacrimation”, “tearing increased (n=24)”. Each description may make sense on its own. But when the group tries to connect them, inconsistent terminology makes it harder to build a coherent map.
So agree on three things up front, the same way you’d agree on a matrix’s columns:
- Node types: the kinds of concepts your map holds. Our demo graph uses Concept, Factors, Gland/cell Type, and Perception.
- Edge types: the relationships that connect nodes. Use directional verbs to express them clearly. Our demo graph uses activates, downregulates, and interaction: SNS-controlled tear production activates Tear secretion.
- Edge statuses and Confidence: how sure the group is of each finding. Agree on what different confidence scores mean before work begins. Otherwise, one researcher’s 0.8 may reflect a very different standard from another’s.
The graph Admin enters the agreed vocabulary in the graph’s Settings, which only admins can open. Configure Your Knowledge Graph walks through the screens.
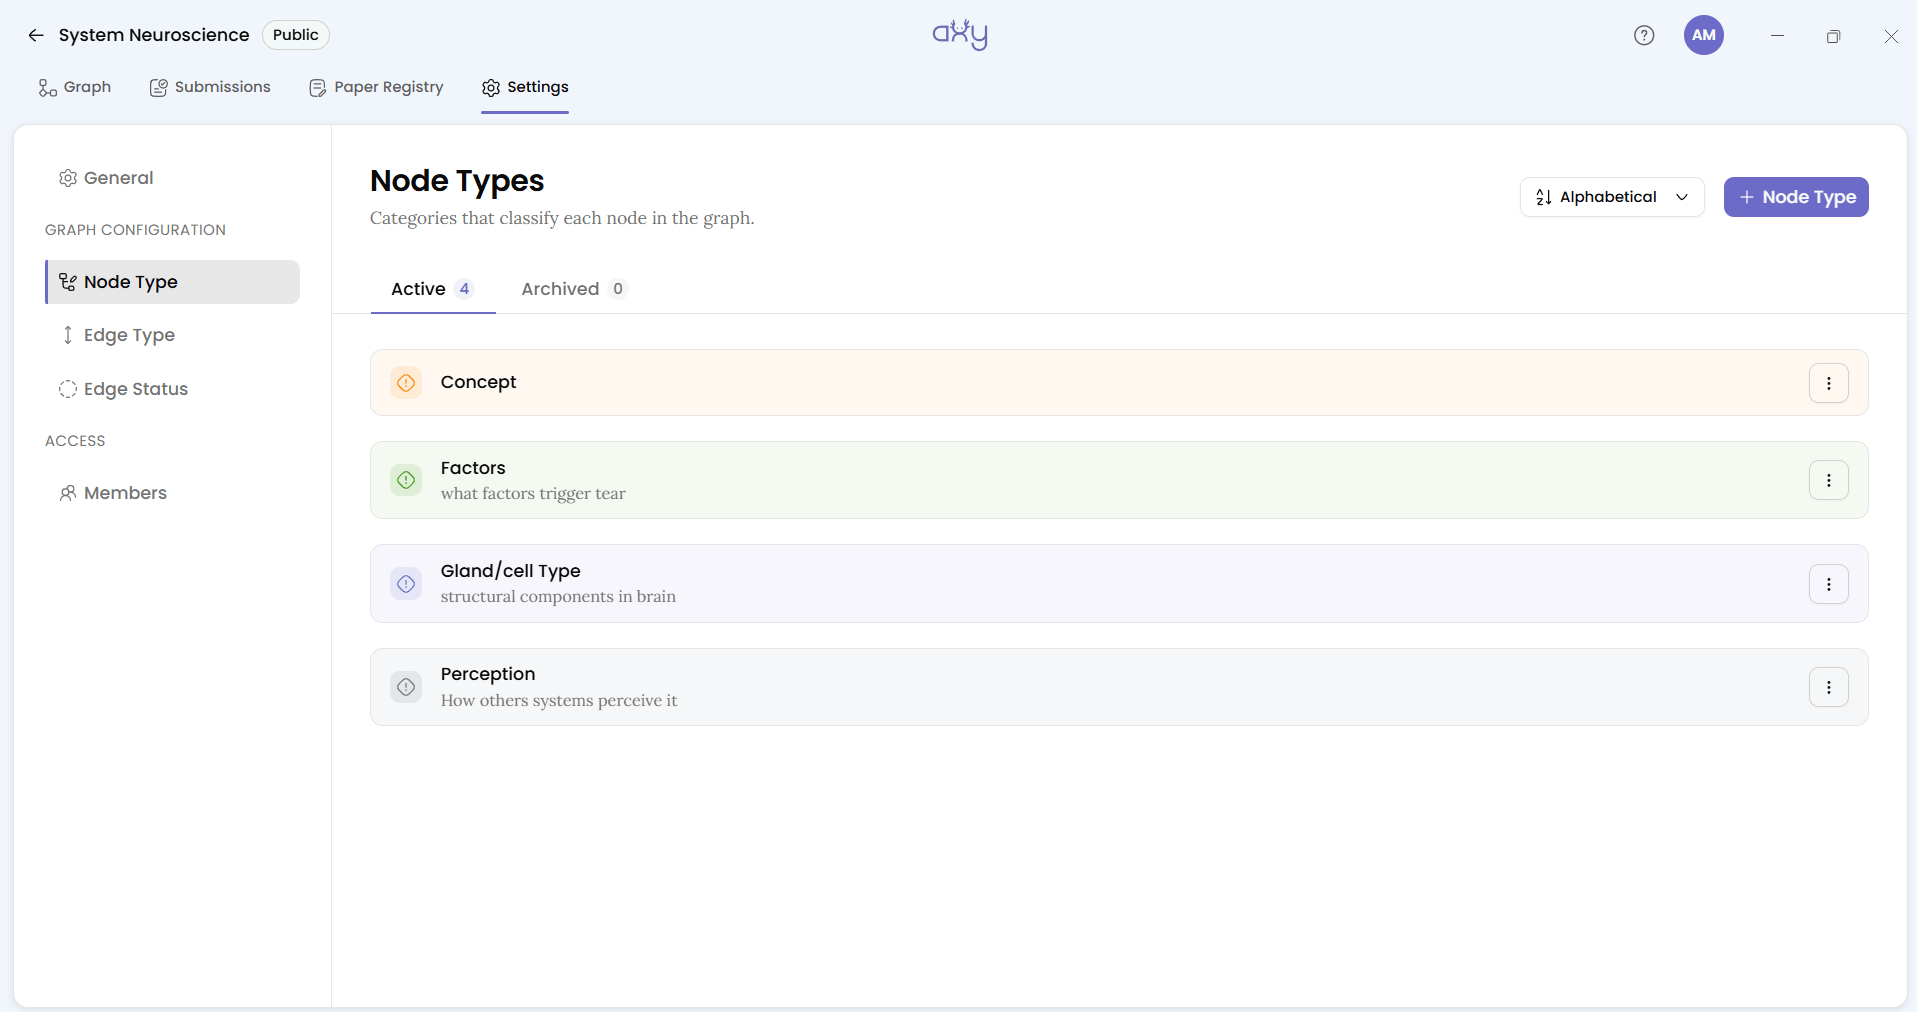
Initially, keep the list short. You can add a new type in week three, but renaming one after forty findings use it is painful.
How to do a literature review in a group
There’s an r/AskAcademia thread with exactly this title, and its replies settle on a shared spreadsheet and one person responsible for synthesising everyone’s work at the end. The risk is that the synthesis becomes dependent on that one person, and the rest of the group may struggle to see how the pieces fit together.
In Axy, the map develops throughout the research study. Everyone contributes to the same knowledge graph, bringing different evidence into a shared structure. Three habits keep it from turning into a mess.
Split the papers, not the map. Give each member a sub-question and the papers that answer it. For our tear-secretion map: one person takes the neural pathways, one takes the emotional triggers, and one takes the physiological factors. Everyone works on the same graph, but each person brings different evidence to it.
Search before you add. Before creating a concept, check whether it already exists. A node’s title is unique inside a graph. Before adding Tear secretion, look for it on Discover with the “Search node / relationship type” bar. If it’s already there, connect your finding to the existing node. That reuse is what joins member A’s papers to member B’s, and without it you get a set of separate islands.
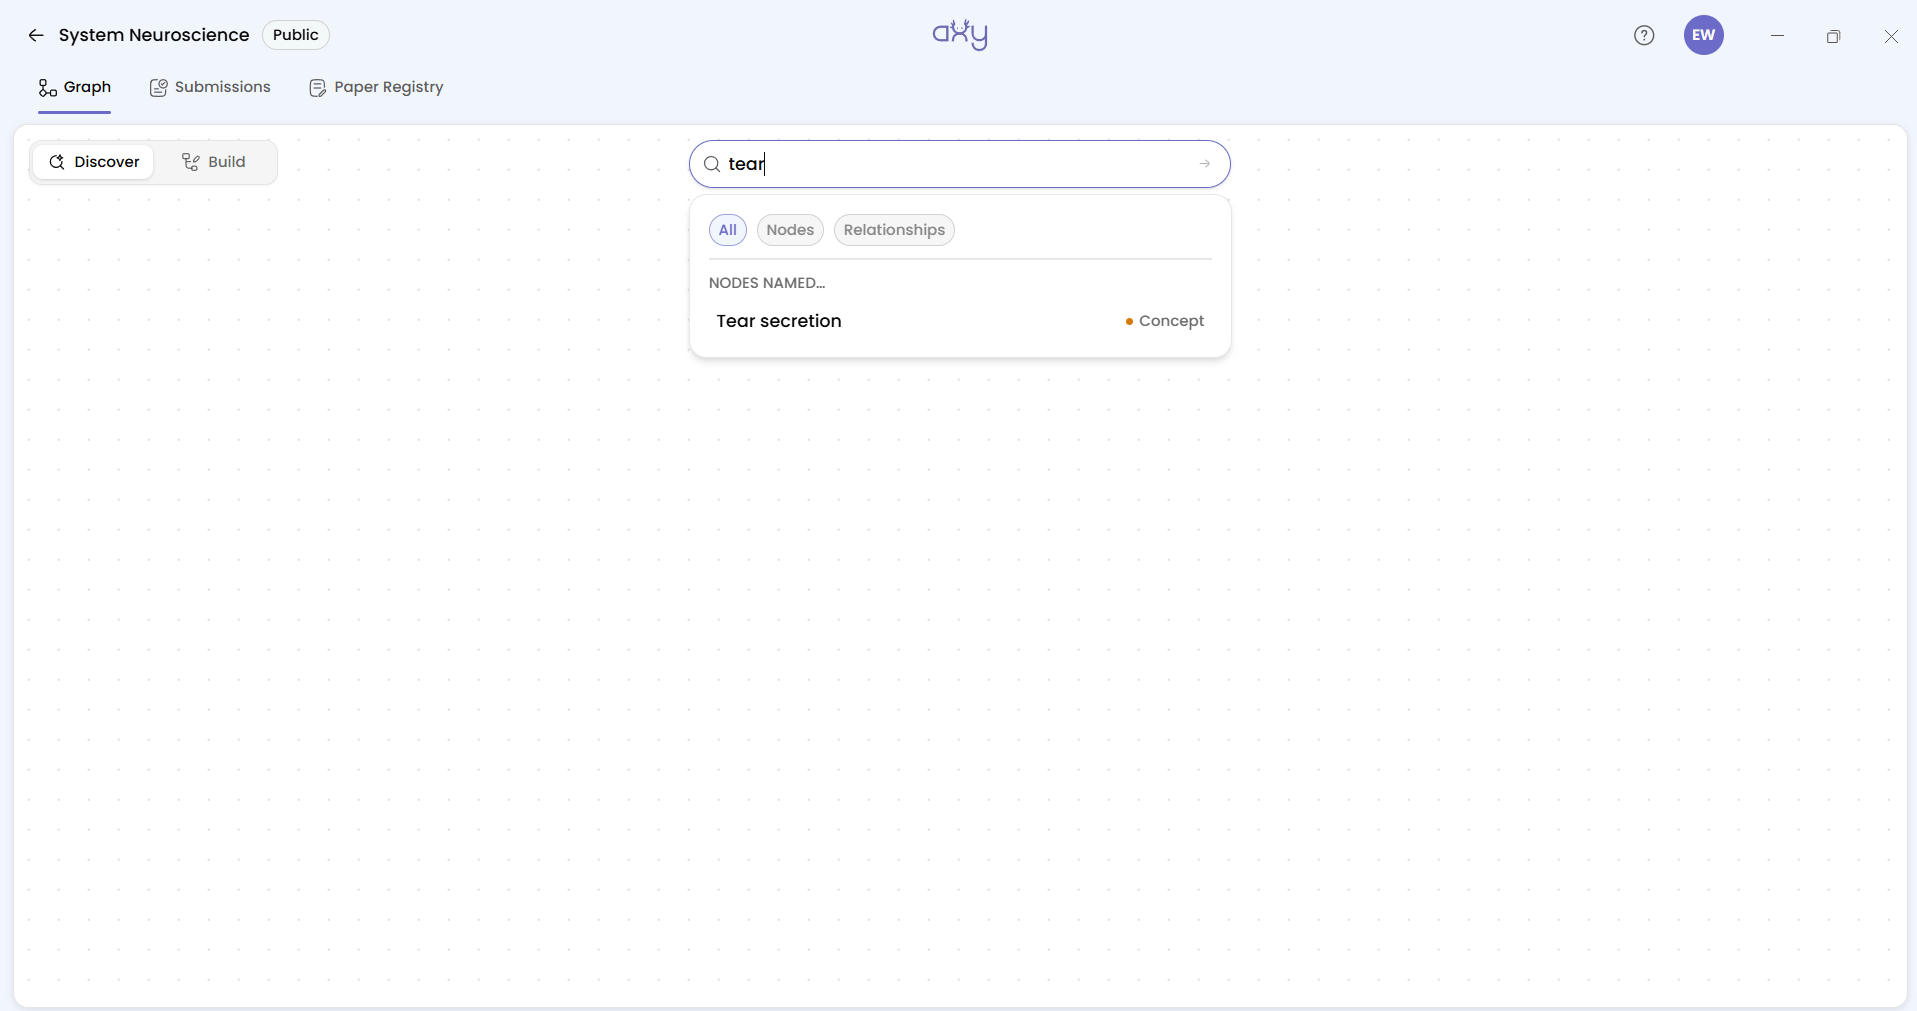
Work in your own draft, and submit in batches. In Build, everything you are working on goes into Your Drafts, which other members cannot see, as work in progress doesn’t appear on the Submissions page.
A useful approach is to complete a sub-question before submitting the batch. That gives reviewers a more coherent contribution to assess and avoids sending every individual finding through the review process separately.
For each finding, open the edge drawer and fill in three fields:
- Evidenced by: type the paper’s DOI into the field marked “Enter name or DOI ID”. Axy pulls the title, authors, and year from CrossRef. The first time a paper is used, the badge reads Will be added to registry on save.
- Confidence: use the slider from 0.00 to 1.00, on the scale your group agreed.
- Edge status: select the status configured by the graph Admin.
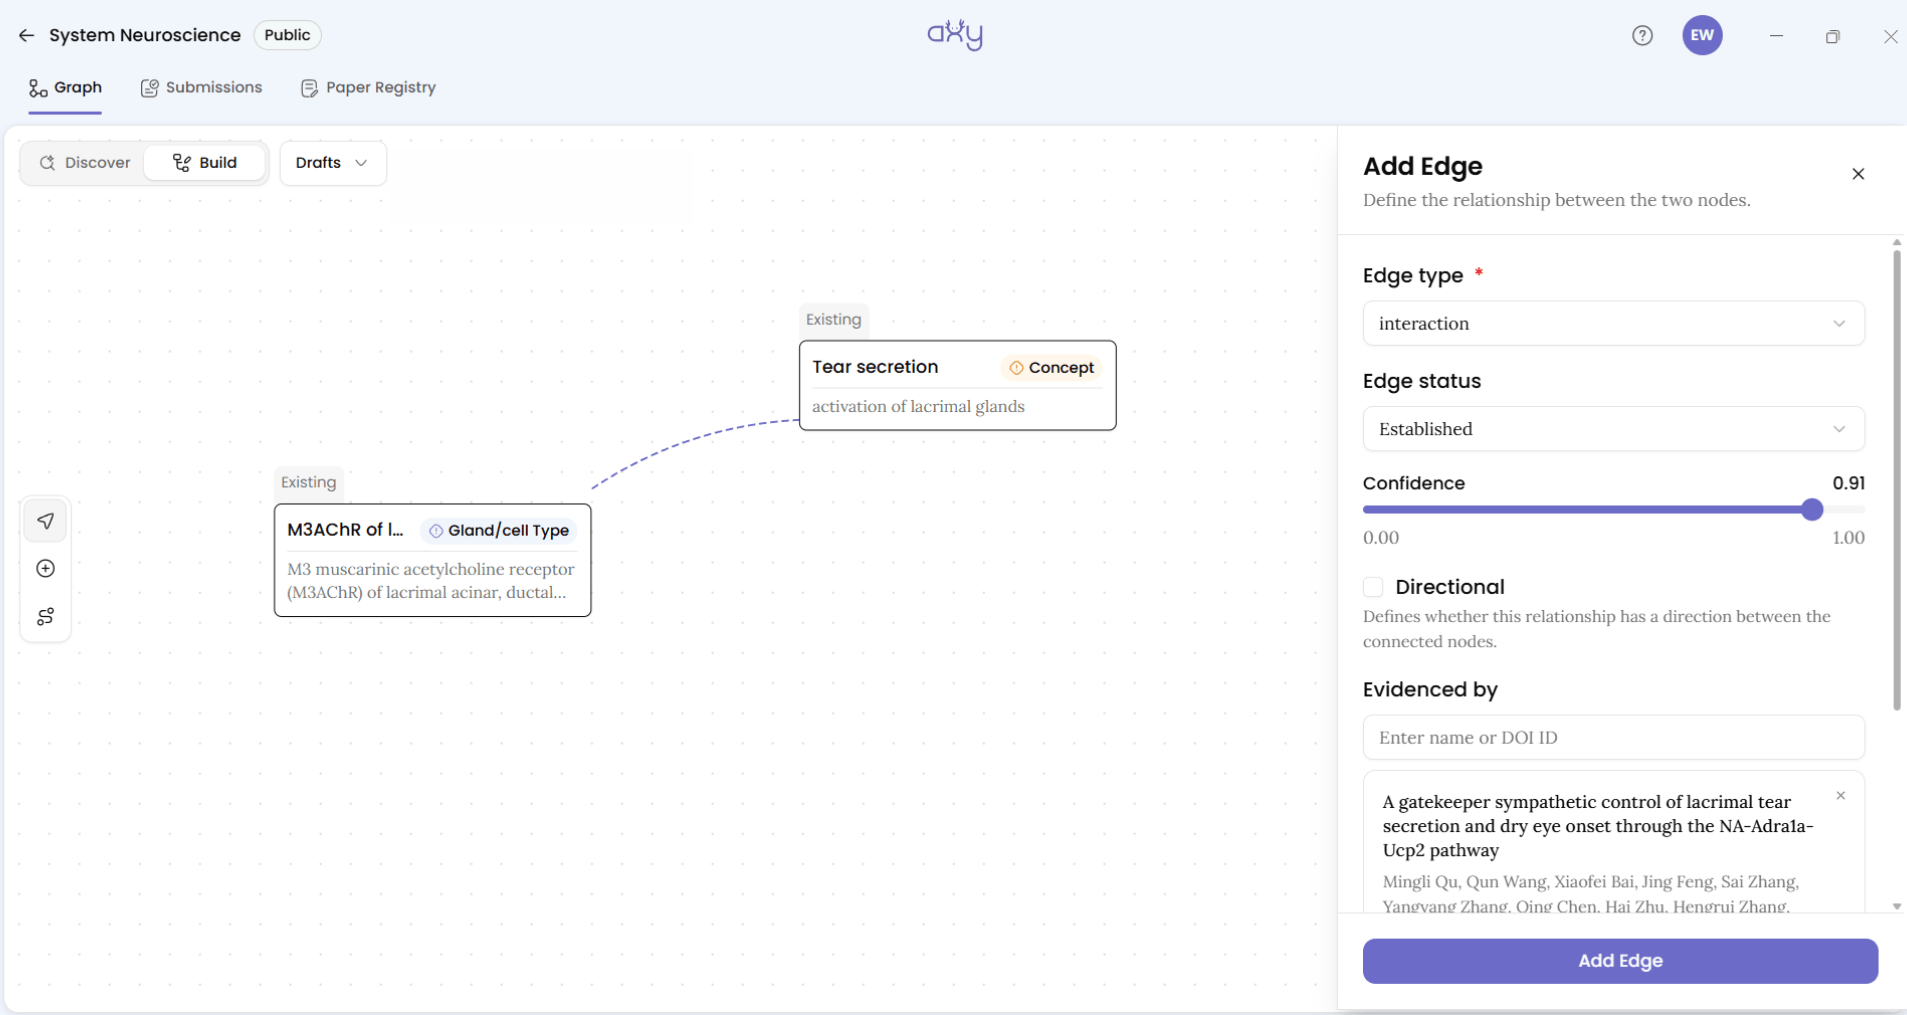
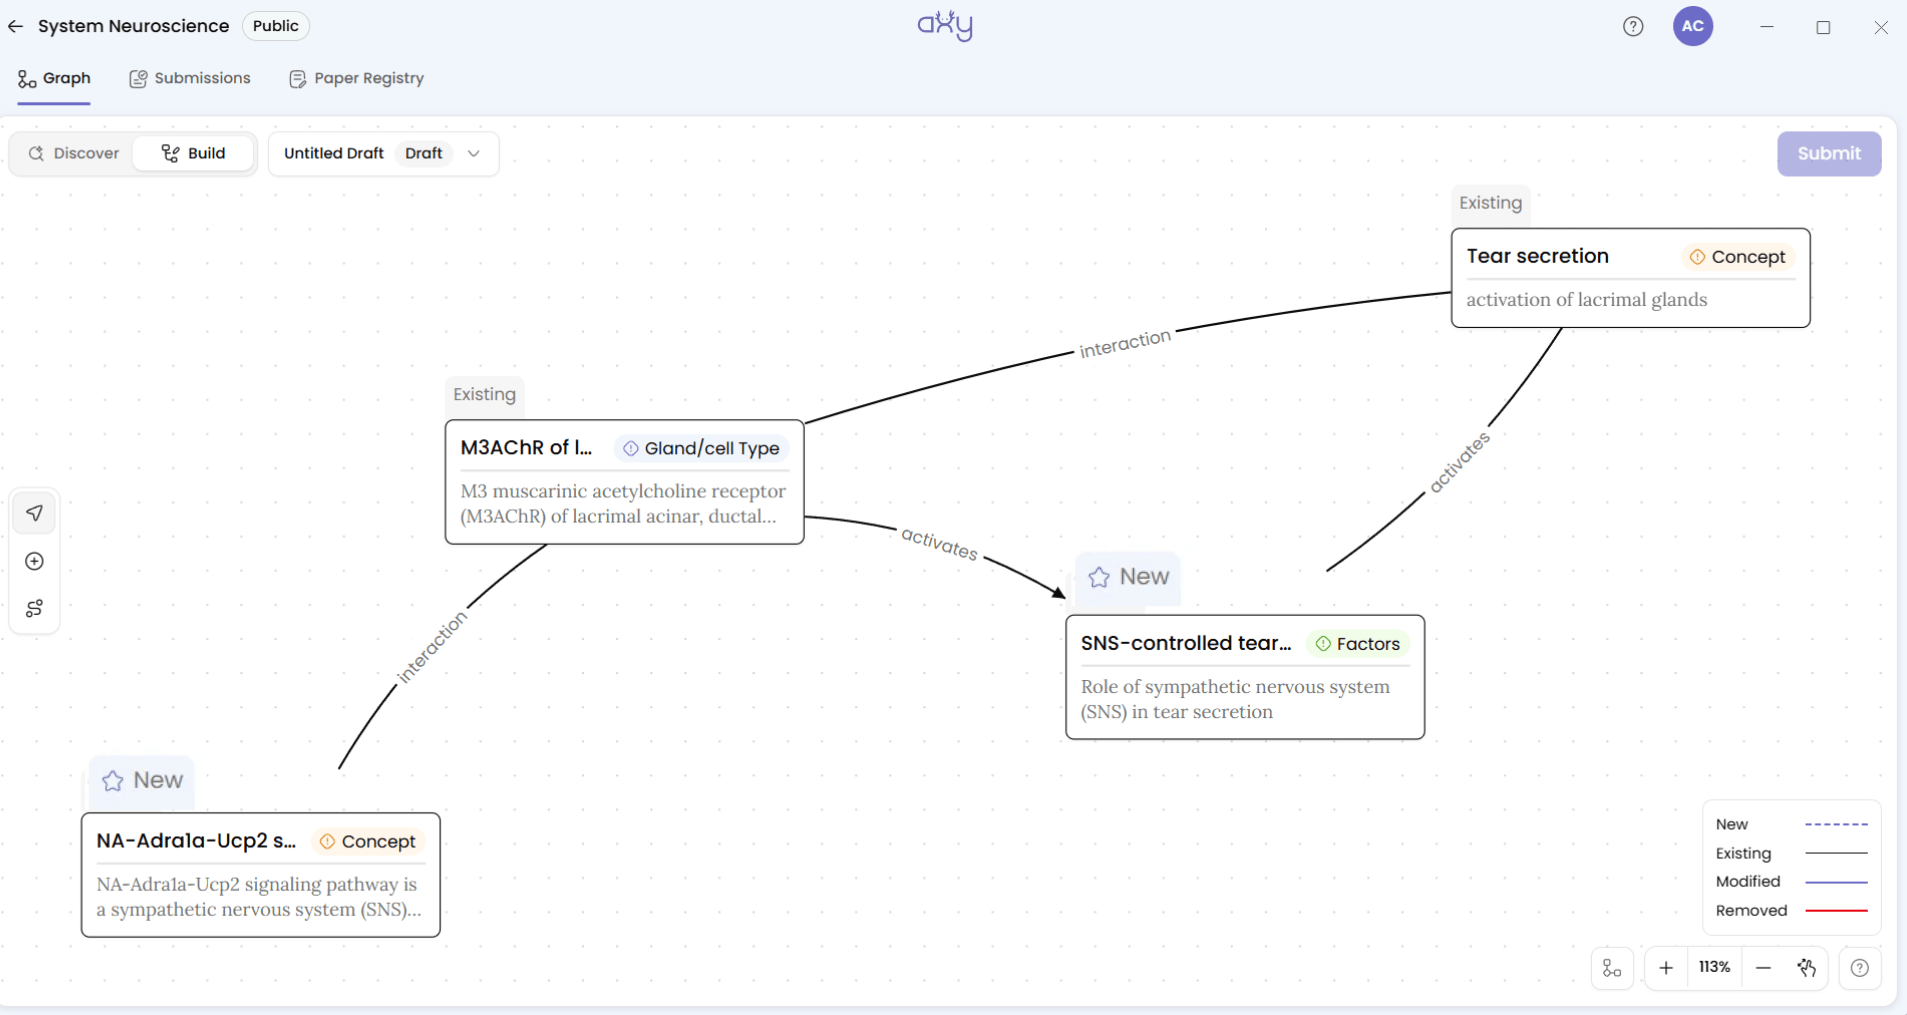
Be realistic about the time this takes. Every finding is entered by hand. There’s no PDF upload, no import from Zotero or a spreadsheet, and nothing reads the paper for you. If you already have a matrix, you’ll be retyping it. It took me about five to ten minutes per paper, from DOI to submission. Multiply that by your paper count before you agree on the deadline.
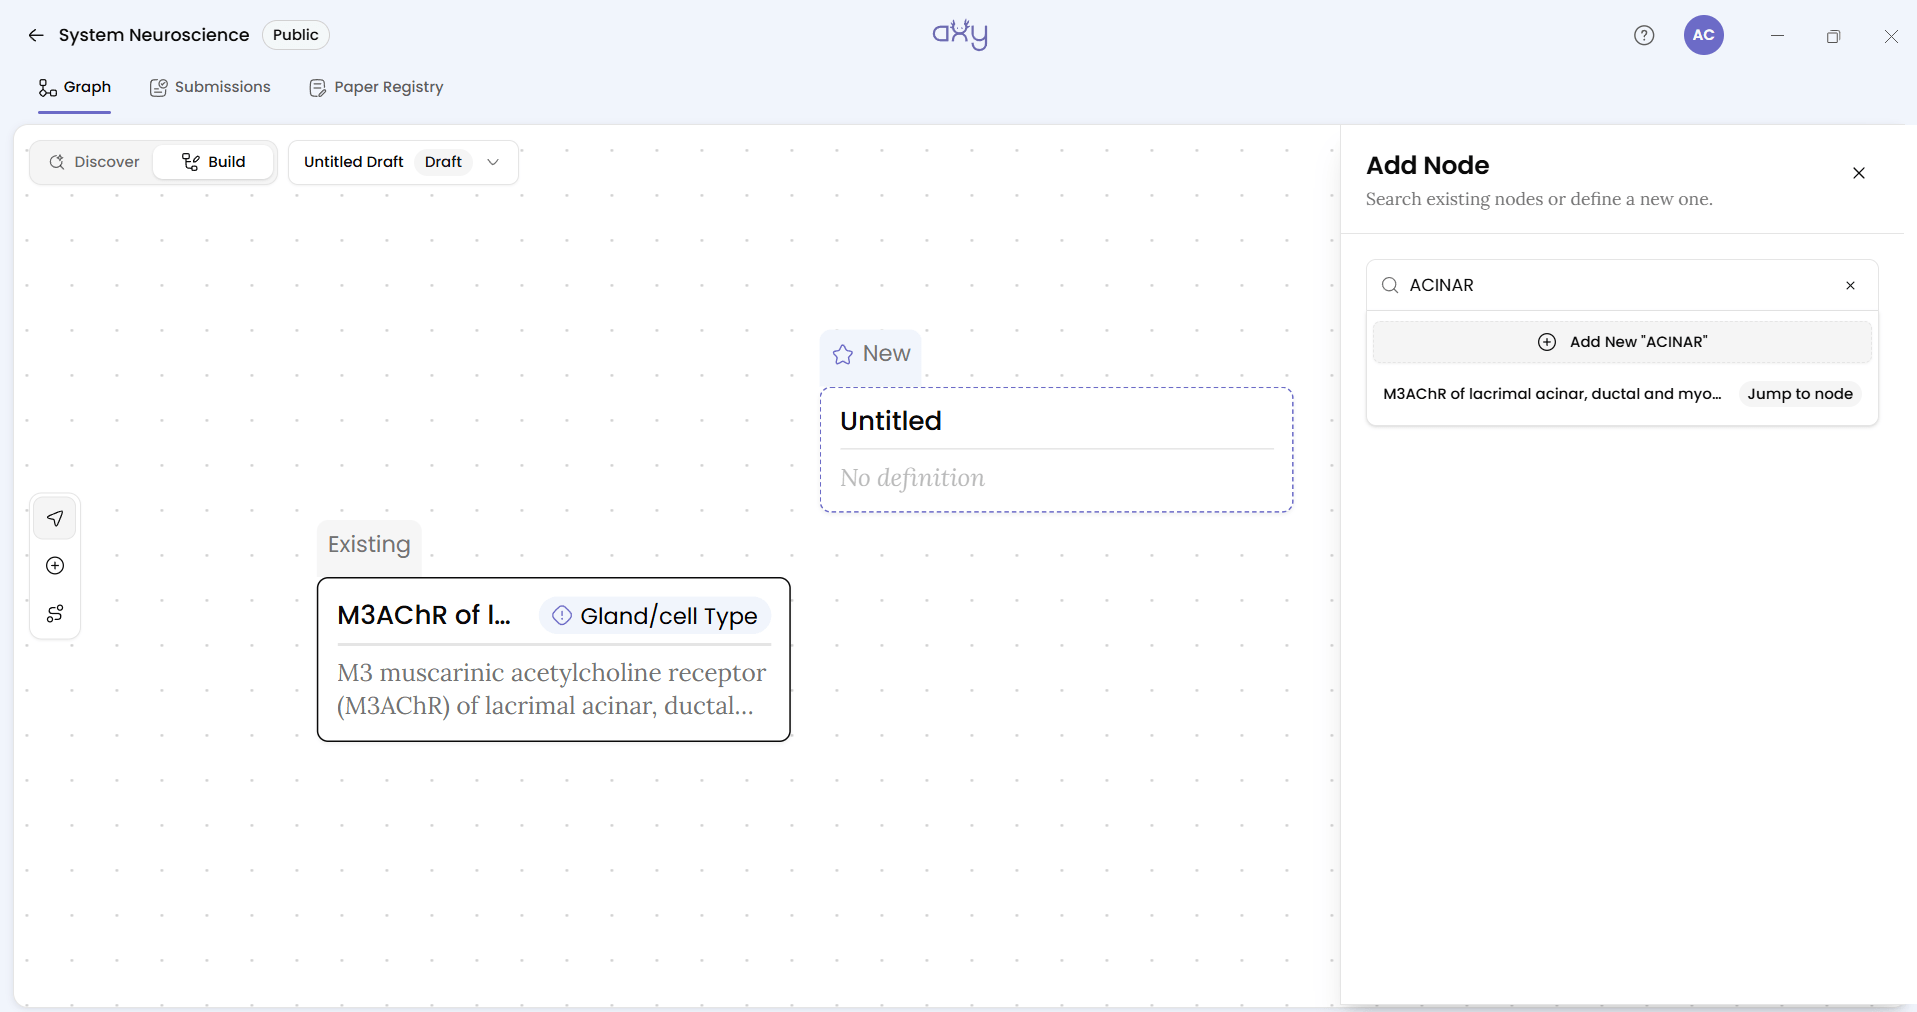
Axy catches certain duplicates within a draft. For example, it prevents the same edge type from being added twice between the same two nodes. You’ll get the prompt: “An edge of type “activates” already exists between these nodes.” But searching for existing concepts remains important, especially when researchers are working in separate drafts. When you type a name into the Add Node drawer, Axy lists the nodes already in the graph that match, each with a Jump to node button, above Add New. Pick the existing node instead of adding a new one, and watch for the same concept under a slightly different name.
A second pair of eyes on every finding
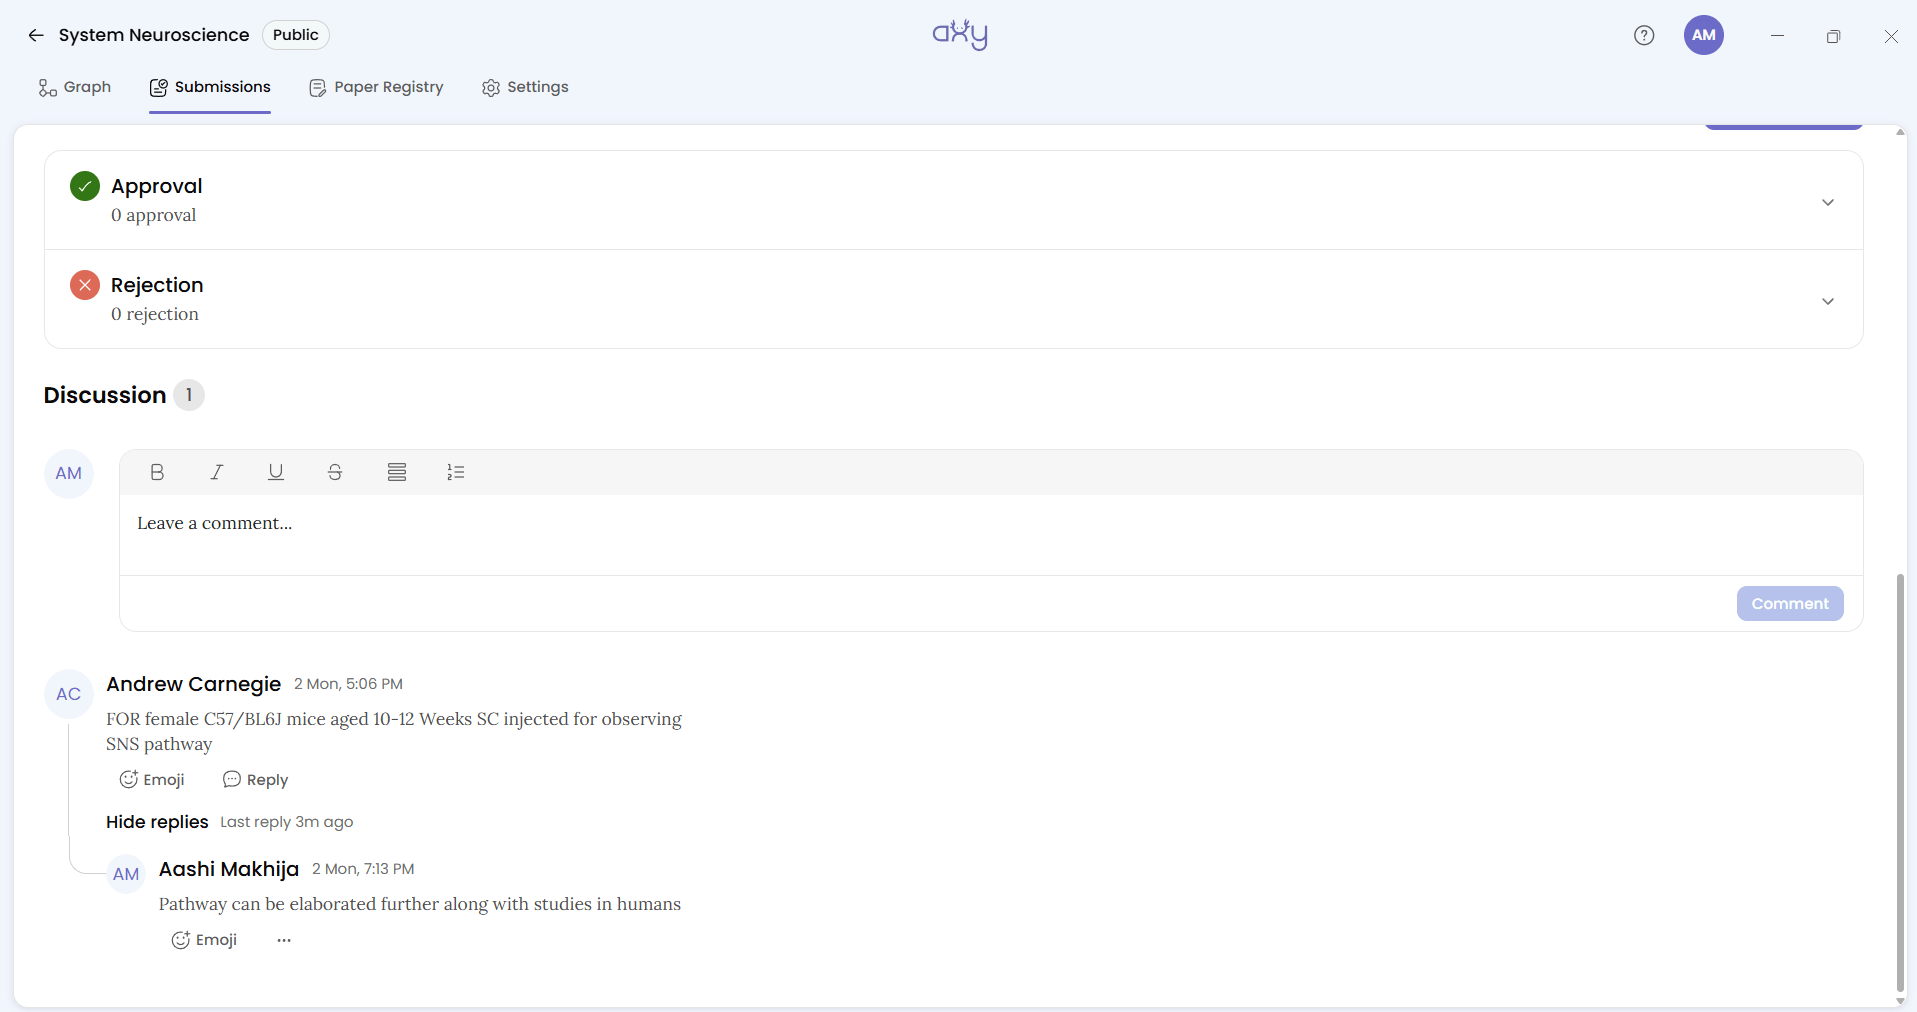
A spreadsheet can collect what each researcher believes a paper found. It doesn’t, by itself, create a consistent review process. A findings map lets you defend your work in front of an audience, because every submission gets reviewed by someone who didn’t write it. The reviewer opens it, reads the findings against the papers, and uses the Discussion to ask the question that matters. Did the study demonstrate an increase, or only a correlation? Was the result observed in humans or in an animal model? Does the proposed relationship reflect the paper’s actual findings, or has the interpretation gone further than the evidence allows?
The author can respond in the same discussion, keeping the question and its explanation together.
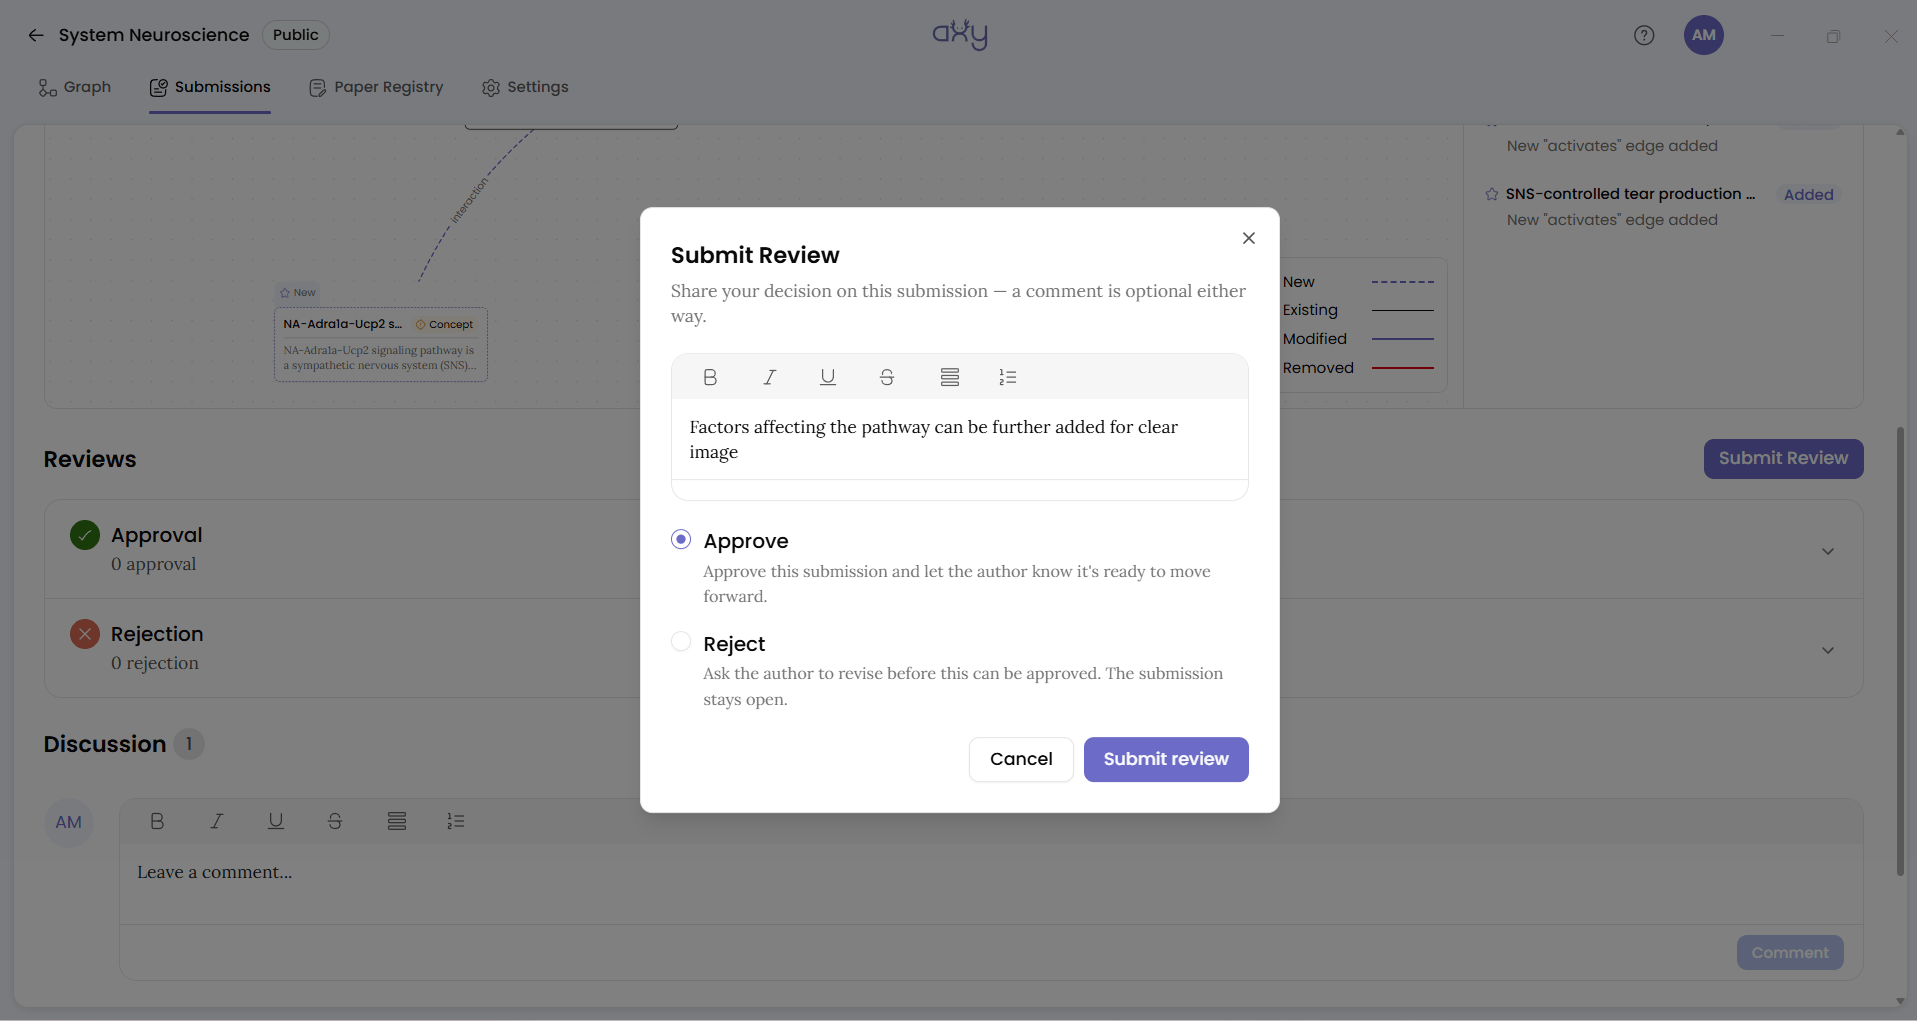
Once the contribution has been examined, the reviewer selects Submit Review and chooses Approve or Reject. The graph Admin can then merge the submission.
See How To Work On Axy As A Team for the complete review and merge workflow. If your group is on a deadline, three practical rules need to be settled early:
- You can’t review your own submission. The button is disabled, so review always comes from someone else in the group.
- Merging doesn’t wait for approvals. The graph Admin can merge whenever they like. Decide your own rule, for example one approval from another member before the Admin merges, and stick to it.
- Nobody is notified. Let the group know when a submission is ready, using your existing group chat or another communication channel.
A consistent review process gives the group a clearer basis for defending its map when presenting the work.
Discover your map
Once the graph contains enough connected findings, it’s time to show the relationships.
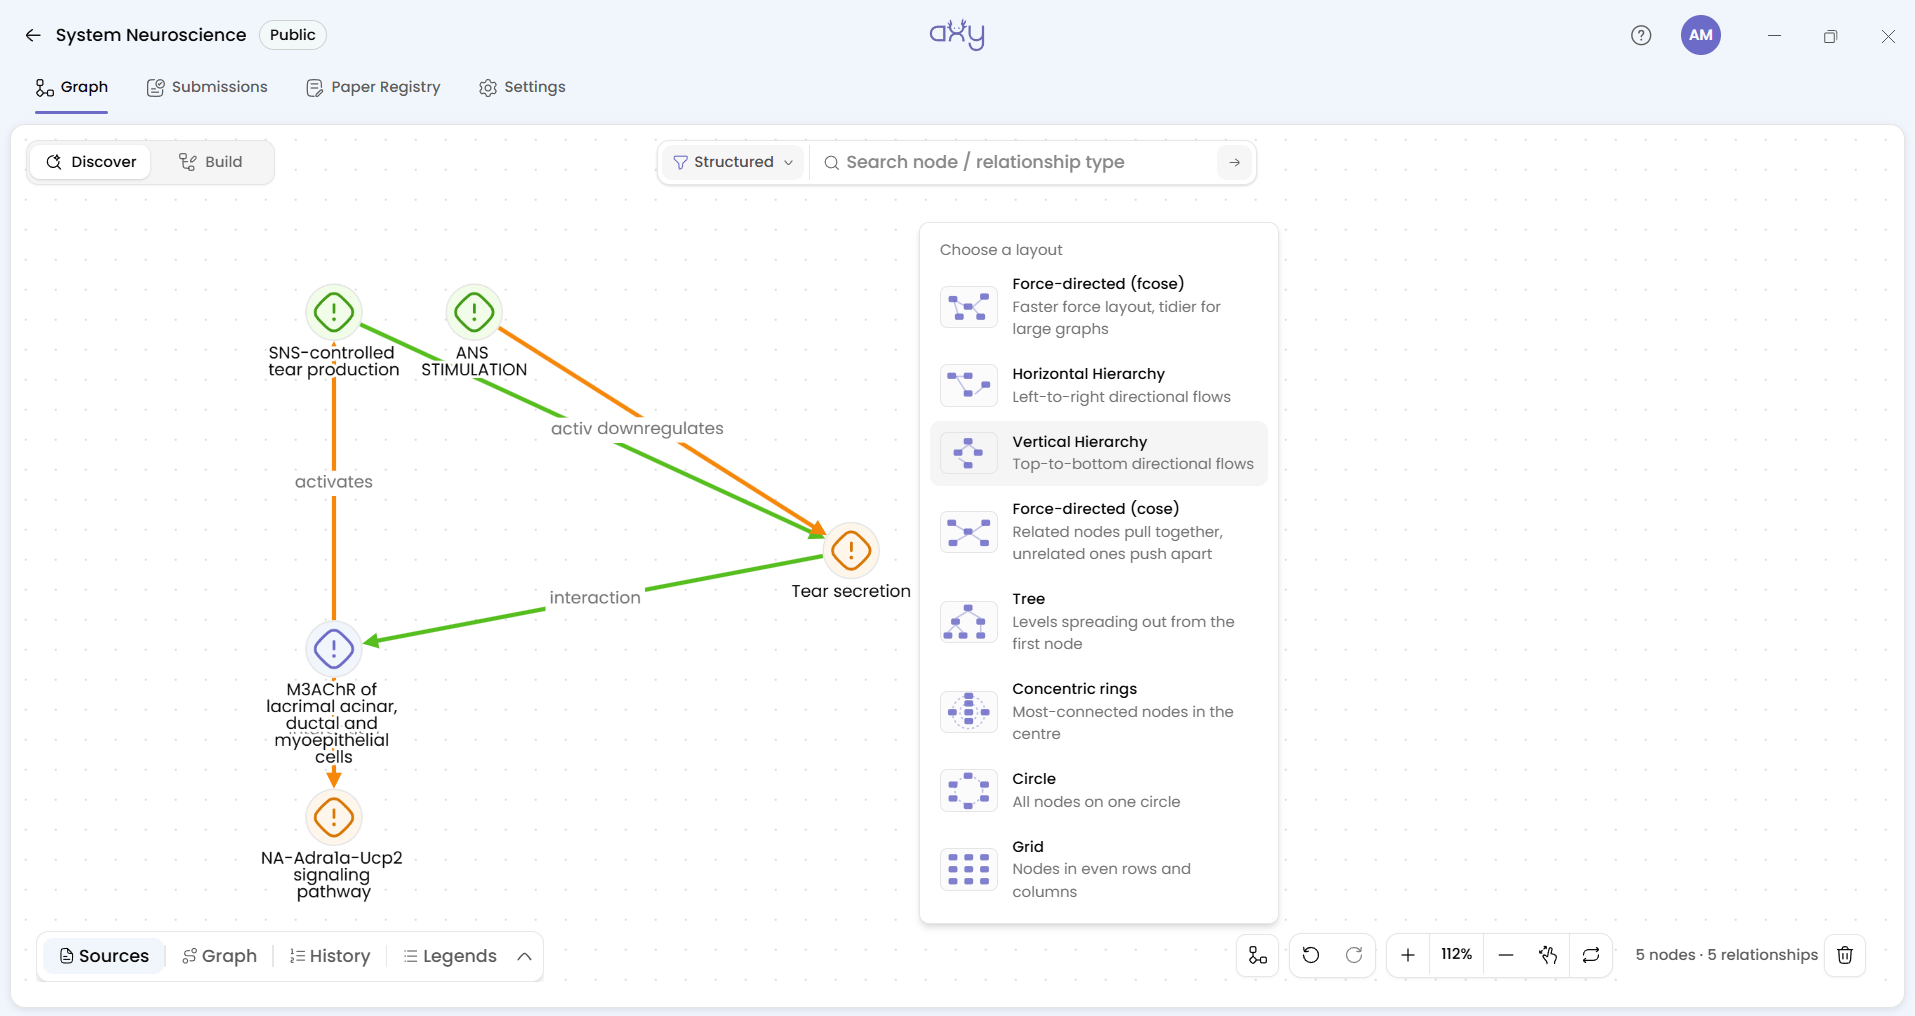
On Discover, search for the concept at the centre of your question, Tear secretion, and add a relationship hop so the findings around it come onto the canvas. Search results add to what’s already there, so you can build the view up a piece at a time.
The layout you choose should reflect how the map will be used:
- Vertical Hierarchy or Tree for a poster. They read top to bottom, the way a printed figure should.
- Concentric rings for a talk or presentation. Put the central concept in the middle and let the findings spread out around it.
Once the layout is in place, select Fit view and open Legends on Confidence.
The graph colours each edge by one of three confidence categories:
- Low (red): below 34%
- Medium (orange): 34–67%
- High (green): 67% or above
Now your audience can see where the field’s evidence is solid and where it rests on one small study. You don’t have to say “more research is needed”, because the colours already show it.
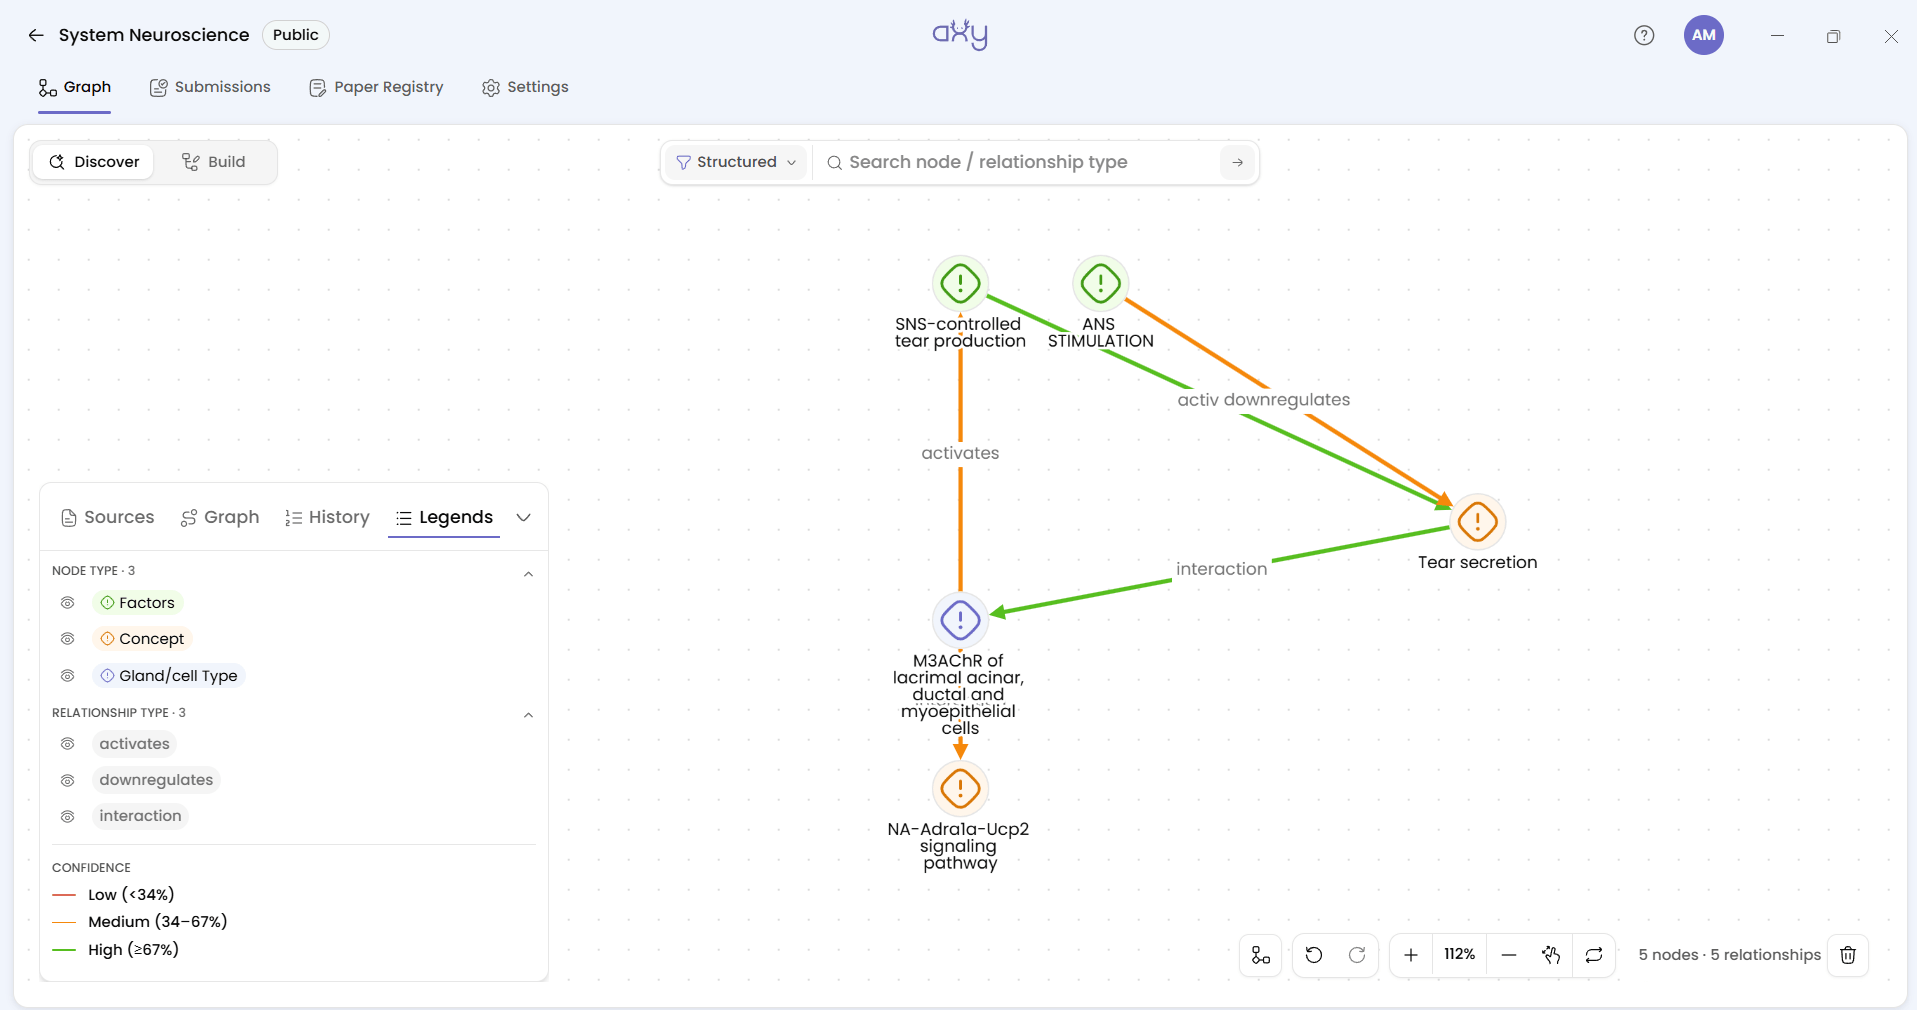
Axy’s Discover canvas has some practical constraints, so plan for them ahead of your deadline.
- The poster figure is a screenshot. There’s no image, PDF or data export. Discover has no full-screen mode, so maximise the window before you take the shot.
- For the talk: you can present the live app from your own screen.
- For sharing: there’s no share link that lets someone read the map without an account. If your supervisor wants to explore the live map, they’ll need to sign up.
- A Discover canvas isn’t saved: when you leave, it’s gone. Write down the search and the layout you used, and you can rebuild the poster view in about a minute.
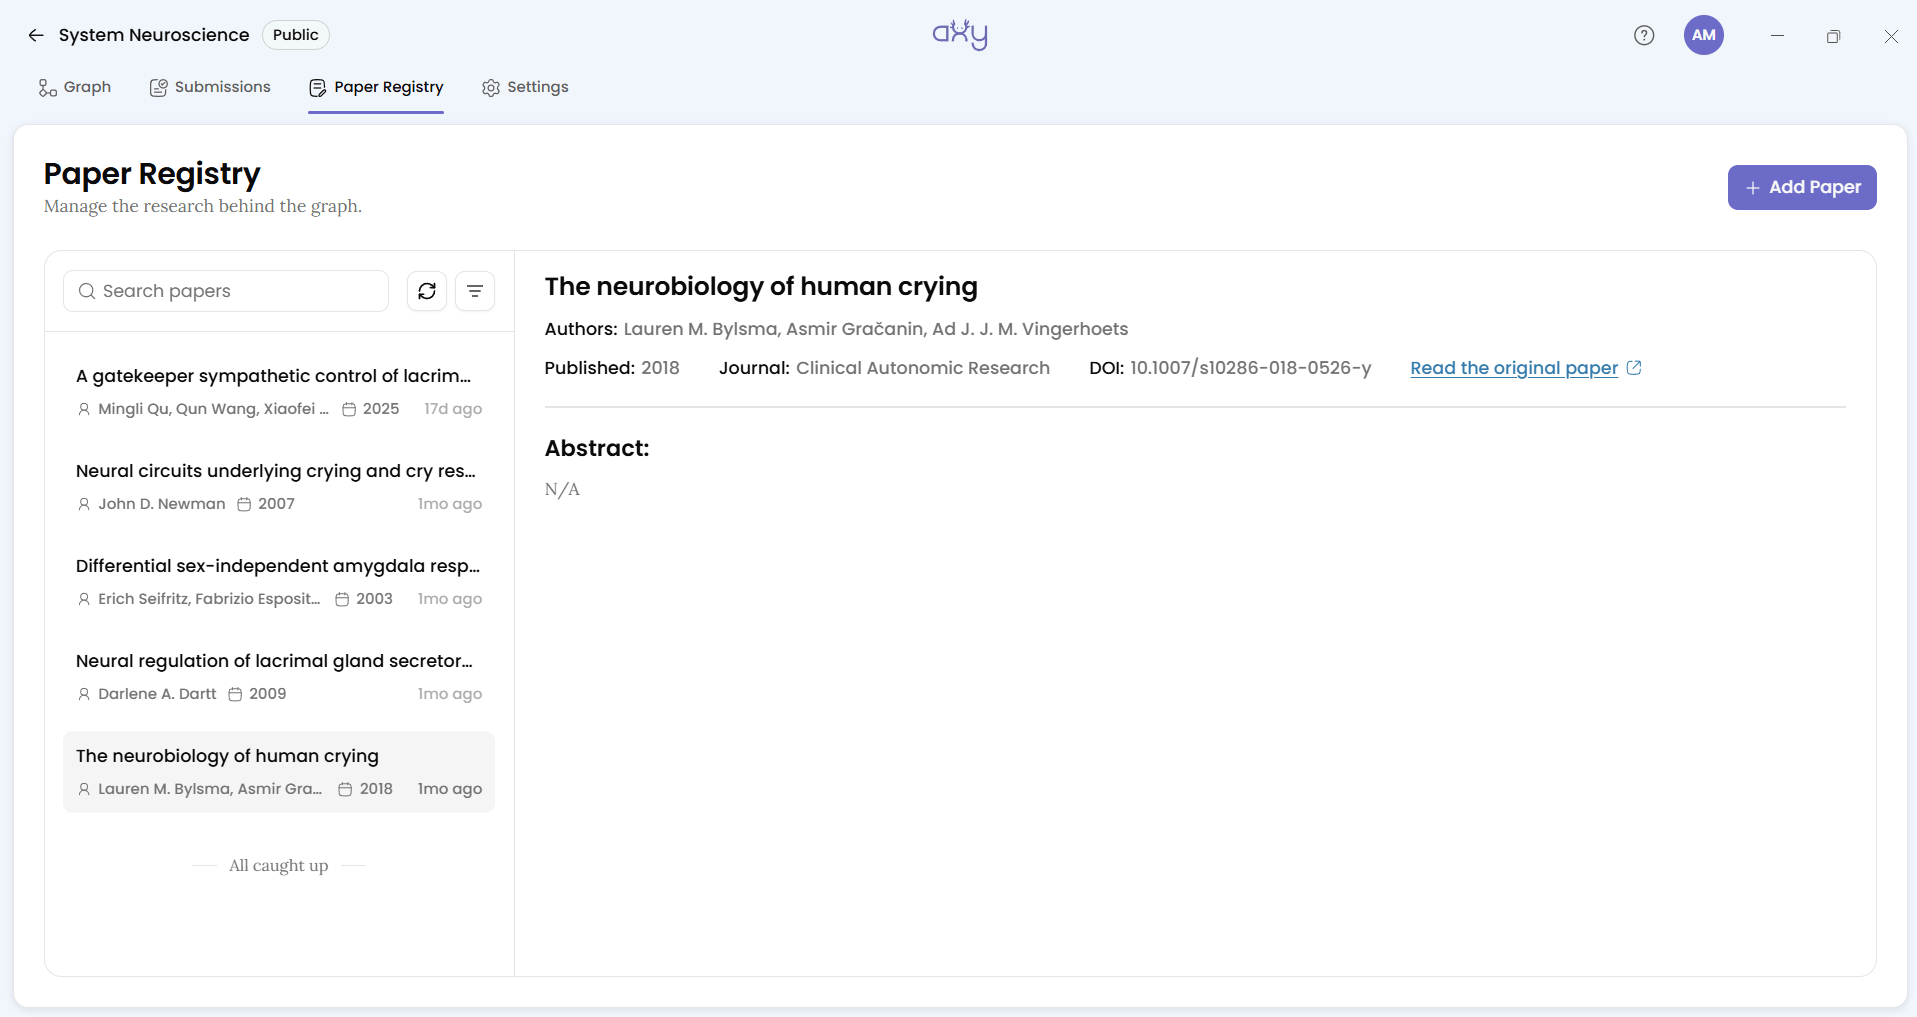
The Paper Registry lists every paper behind the map, searchable and filterable by year. It’s a good check that nothing was missed, but your poster’s reference list should still come from Zotero.
Keep the map after the deadline
Most group literature reviews end the day they’re presented. A question on Academia Stack Exchange about starting a lab wiki puts the cost plainly: expertise lost “over the years (PhD cycles).” It shows up in spreadsheets that go into a shared drive, posters that go onto a wall, and a next cohort that starts again from nothing.
A findings map doesn’t have to go that way. Every finding remains tied to its DOI, and every reviewer’s question stays in the Discussion. The next student to join the lab can read it in an afternoon instead of rebuilding it over a semester, and the group can keep adding papers as they come out.
What Axy doesn’t do
Know the Axy app realistically before you plan a deadline around the tool.
- It doesn’t discover papers. Your citation-map tool does that.
- It doesn’t build the map for you. Every finding is typed in by a person, from a DOI.
- It doesn’t find the gaps in the literature. You see them, on the Confidence legend and in the parts of the map with no edges. The tool doesn’t compute them.
- It has no import and no export: nothing from Zotero, a spreadsheet or BibTeX on the way in, and no image, PDF or reference list on the way out.
- It doesn’t hold PDFs, annotations or citations. Keep your reference manager.
- It doesn’t notify anyone, and reviewers can only approve or reject, not request changes.
Start before anyone adds a node
You don’t need to wait until the whole reading list is complete. Start by agreeing on the structure that will hold your findings together.
- Download Axy and set up one public graph for your knowledge map.
- Bring the group together to agree on node types, edge types, statuses, and what confidence scores mean. Enter the vocabulary before anyone opens Build.
- Split the papers by sub-question, and agree on your review rule.
Your group will read the papers either way. This way, what you found is still there after the poster comes down.


