


Open the species list your research group uses. If you work on great apes, look up the orangutans.
For much of the last century, orangutans were classified as a single species. Later, Bornean and Sumatran orangutans were recognised as separate species. Then in 2017, Nater and colleagues described a third, the Tapanuli orangutan, Pongo tapanuliensis, from the Batang Toru forest in North Sumatra (Nater et al., 2017). A list written before 2017 misses an entire species, and nobody in the lab notices until a reviewer, a collaborator or another researcher points it out.
Every group has a story like this one. Species are reclassified, genera are revised, and names once treated as separate species may turn out to be synonyms. Taxonomy changes as new evidence emerges, but the spreadsheets and reference lists researchers rely on don’t necessarily change with it.
This is where Axy Open Taxonomy, an open tree of named life, comes in. It shows where every name came from, along with the paper behind it. Each name and its connections to other taxa carry source information, giving researchers a way to trace where a classification comes from.
What the graph is
Axy Open Taxonomy brings together data from four open sources to create one connected tree of named life:
- WoRMS: provides marine species data.
- Catalogue of Life: covers the wider diversity of life.
- ITIS: supplies fish records.
- Open Tree of Life: provides identifiers that help connect records across these sources.
Together, the graph contains approximately 5.6 million names.
We only used sources that are licensed for commercial reuse. That choice left some things out, and What’s not in the graph below lists them with numbers.
The taxonomic work behind it was done by the editors of WoRMS, Catalogue of Life, ITIS and Open Tree of Life. Axy brings their data together and republishes it as one graph, so researchers can explore the data, understand the relationships and identify entries that may need attention.
If you maintain a checklist yourself, the relevant source databases remain the places to submit formal corrections.
Open Axy Open Taxonomy
Start by opening the graph and signing in. You’ll land on Discover, the space where you can explore a knowledge graph.
If you’re new to Axy, sign-up asks you to create an organisation first. Once you’re in the app, look for the Public Graph tab under Explore Knowledge Graphs and open Axy Open Taxonomy.
You don’t need to download anything, and reading a public graph costs nothing.
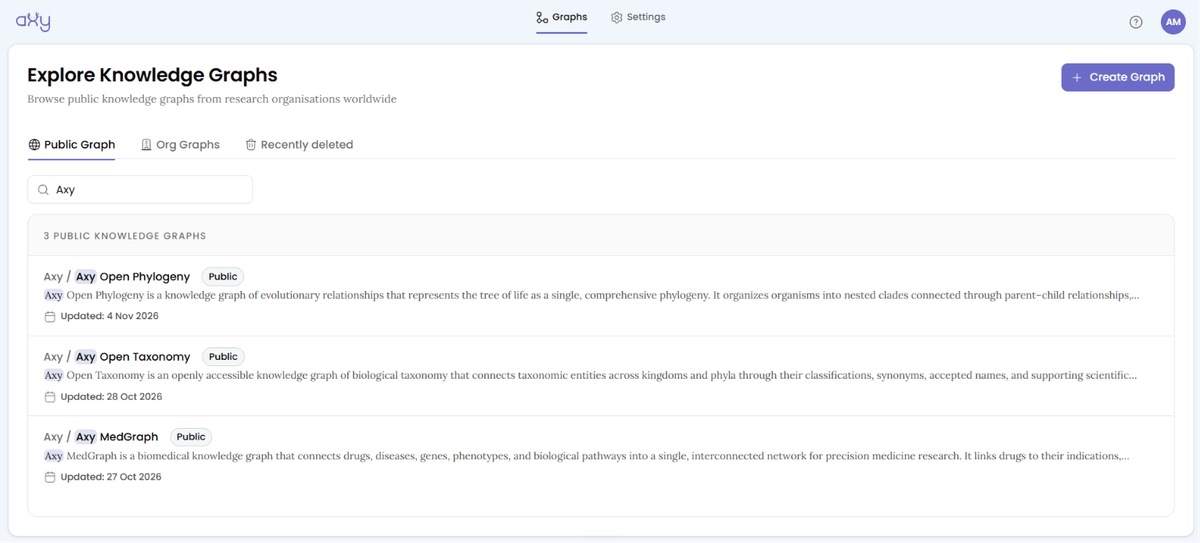
The idea is simple: rather than searching through separate databases or relying entirely on an old spreadsheet, you can explore taxonomic names and their relationships in one connected view.
Find your group
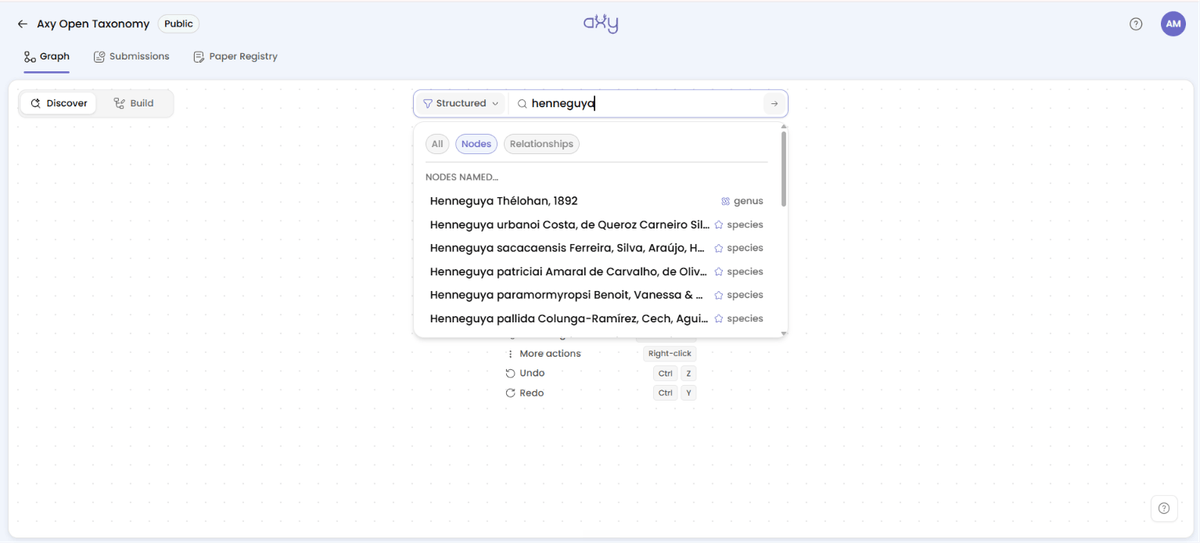
The search bar at the top of Discover has two modes. Use Structured search.
Here’s how to get started:
- Type your genus or family into “Search node / relationship type”: Henneguya, for example.
- Select the relevant result under Nodes named…, and it comes up on the canvas.
- Open its connections using Show Henneguya’s connections, then use +Add → Add this node for the parent and the species you want.
- If a node is already displayed, Axy marks it as Already on canvas.
Working with a large family? The initial results may not show every entry. Use Load more to bring in the rest.
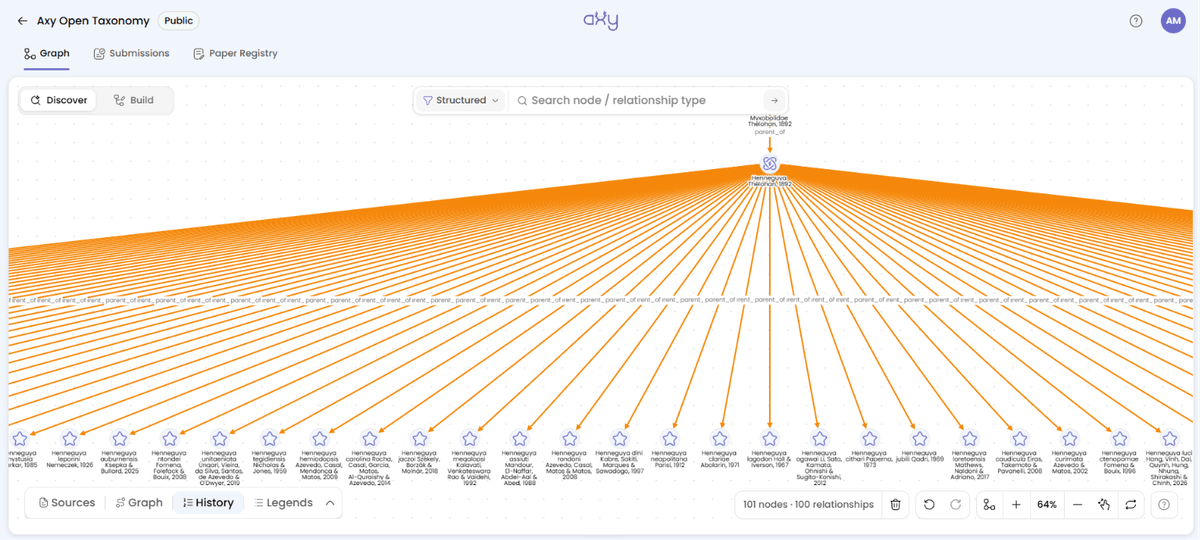
At this stage, you may have several taxonomic names displayed, but the arrangement might not yet look like a tree.
To make the hierarchy easier to follow, open the layout picker at the bottom and choose Vertical Hierarchy or Tree. The nodes are arranged from higher taxonomic ranks down to the species, making the lineage much easier to read.
This gets useful when you’re checking several related species or preparing to compare your existing checklist with the classification represented in the graph.
Read the names with evidence
Finding a species is only the beginning. The more important question is: where does this classification come from?
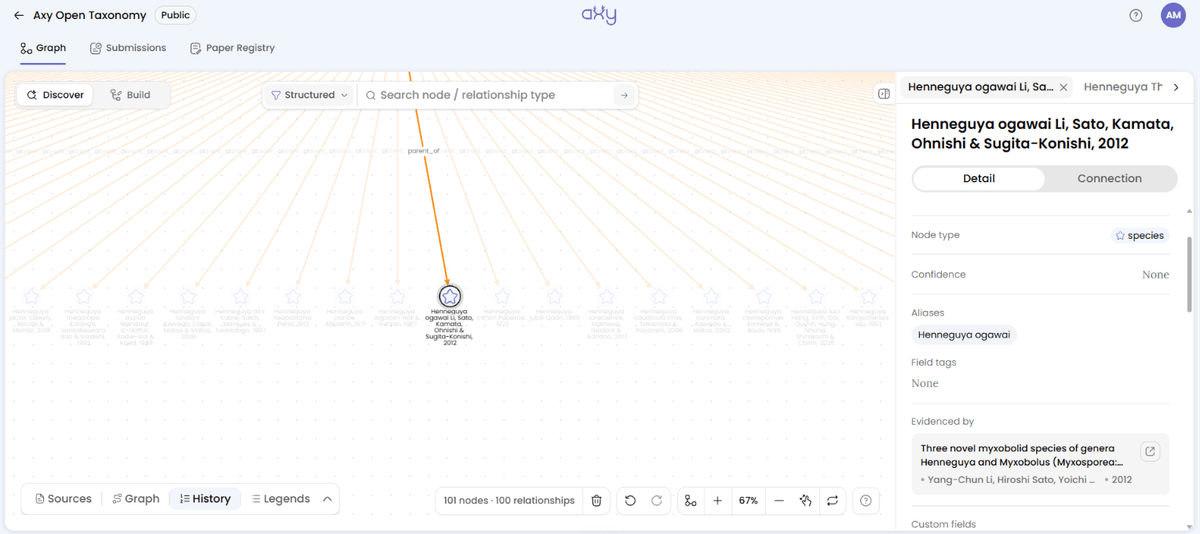
Select a species on the canvas to open its details pane. The following information comes up:
- Node type: its taxonomic rank.
- Aliases: its synonyms.
- Evidenced by: the public source associated with the name.
But don’t stop at the species node.
Now click the edge connecting the species up to its parent genus. It shows the Edge type, Edge status and Evidenced by.
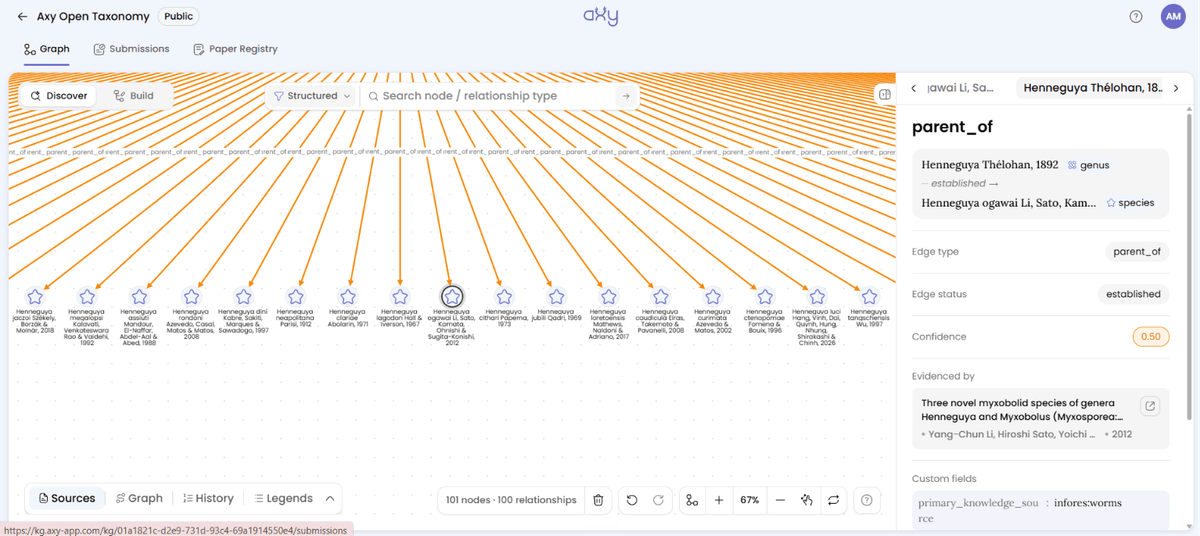
Open Sources in the bottom dock and you’ll see every source behind what’s on your canvas. If your genus draws on WoRMS in one place and Catalogue of Life in another, this is where it shows.
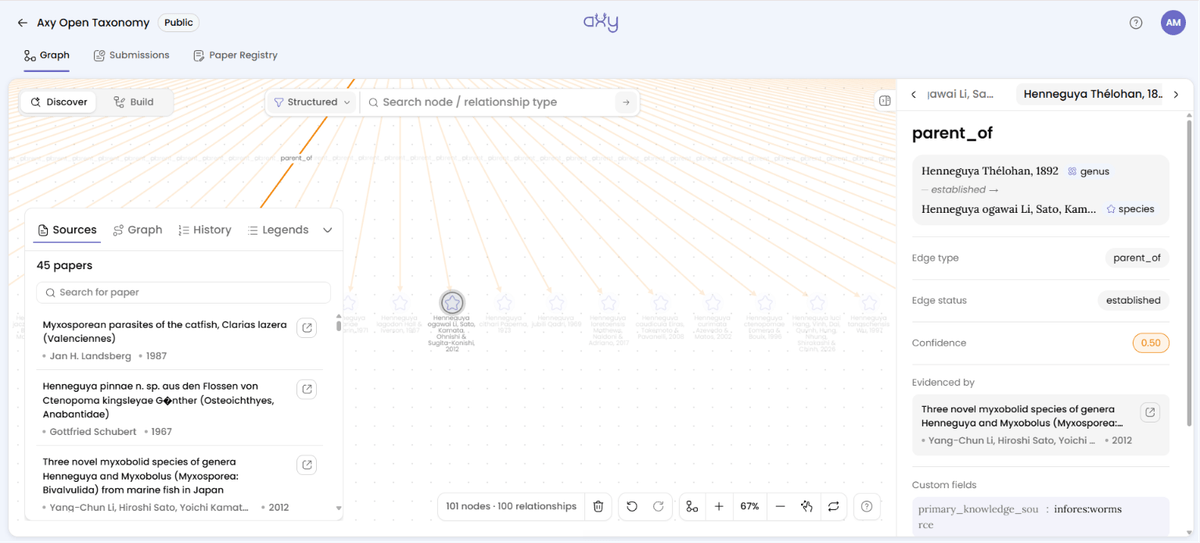
Compare that with a spreadsheet row that says Henneguya Thélohan. The row doesn’t say who decided that, or when. Here, every name and every link to a parent carries its source.
Found something incorrect? Fix it with the paper
Suppose you notice that a species is still listed under a genus it has been moved out of, or that a synonym appears to be treated as a separate species.
Rather than simply changing a spreadsheet entry, you can propose a correction directly in Axy. The important part is the evidence. A proposed taxonomic change should be supported by the paper that establishes or explains it.
Here’s how the process works:
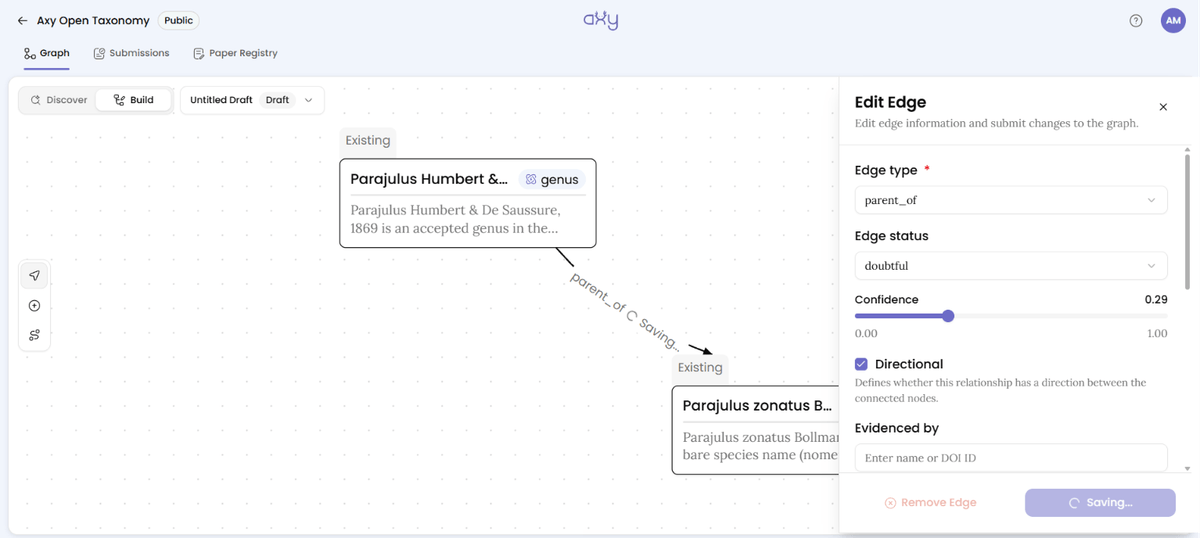
- Switch from Discover to Build and open a draft. What you change stays in Your Drafts until you submit it.
- Make the change:
- To correct a name or its synonyms, use Edit Node.
- To move a species to another genus, use Remove edge on the old parent, then add a new edge to the right one.
- In Evidenced by, enter the DOI of the paper that settles it. Axy reads the paper’s details from CrossRef, so the DOI has to resolve there.
- Select Submit for Review.
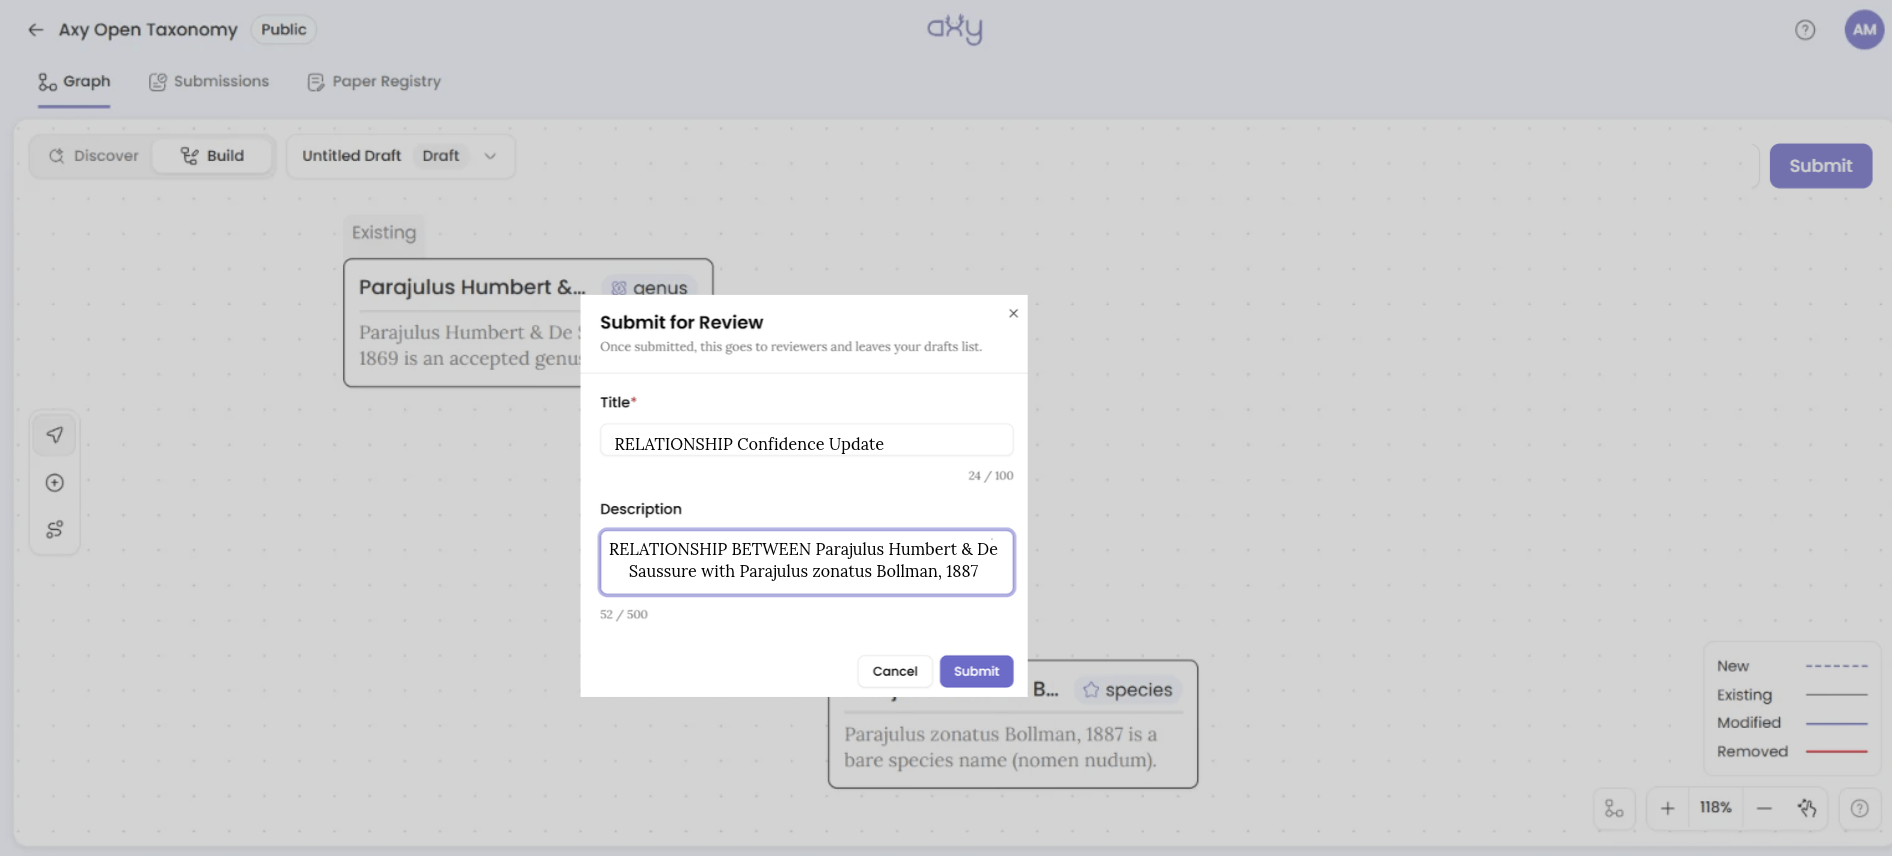
A fix merged here changes Axy’s copy only. It doesn’t reach WoRMS or CoL, and Axy doesn’t sync with them. If you’ve found a real error, send it to that source’s editors too.
The Axy team reviews proposals on this graph, and only an Admin can merge one. There’s no promised turnaround, and you won’t be notified when yours is merged, so check back. How To Work On Axy As A Team explains how review and merge work.
Every change needs a paper and a reviewer. That’s what keeps a shared tree from drifting the way a shared spreadsheet does.
Your lab’s own graph
You can’t add your lab’s findings to Axy Open Taxonomy, and you wouldn’t want to. The public tree holds names and lineages. What your group studies about those species belongs in a graph your lab owns.
Axy can load your group’s part of this tree into that graph once, as its base. Your group then adds what it studies on top, each finding with its DOI and checked by a second member. After that, Axy doesn’t keep the base up to date with new releases, and your lab maintains what it adds.
How To Make A Literature Map With Your Research Group shows how a group builds findings into a shared graph.
What’s not in the graph
There are some important gaps to be aware of:
- Fish are the thinnest group. The WoRMS open copy has 107,796 fish records that came from FishBase, which is non-commercial, so they’re held back. ITIS supplies 29,314 fish species instead, against about 37,500 in WoRMS.
- 24,610 fossil names from the Paleobiology Database are left out, because no licence is stated for them.
- No conservation status. IUCN restricts reuse of it.
- No traits, distributions or common names, yet.
- 2,435 name matches between Catalogue of Life and WoRMS are still under review, and bacteria are classified two ways side by side.
If you need lineages as a table for a long list of species, use taxize or taxonkit, since Axy has no export. If you need maps of where species occur, use GBIF.
Look up your group’s species list
Open Axy Open Taxonomy, search for your genus, and compare it with your lab’s list. If you find something wrong, you now know how to fix it, with the paper.
If you run a lab or build graphs: Axy can load your graph, or your group’s part of this tree, into a graph your community curates, with every proposal carrying its paper and going through review before it’s merged. Reach us through the support chat on axy-app.com or in the app, or on Discord.


