


This picks up where Setting Up Your First Private Knowledge Graph left off. You need a graph of your own to work in — if you don’t have one yet, start there first.
2026 isn’t about stacking PDFs or drawing a flow chart. Knowledge Graphs on Axy help you grow by claiming and reviewing existing knowledge with your lab members. You add project concepts, define how they connect, back the connection with the research paper you read, propose any change to existing ones, and merge it in. On your own private graph, you do all three.
By the end of this guide, you’ll have: not just a node, not just a connection, but a structured, evidenced contribution.
Open the Graph tab
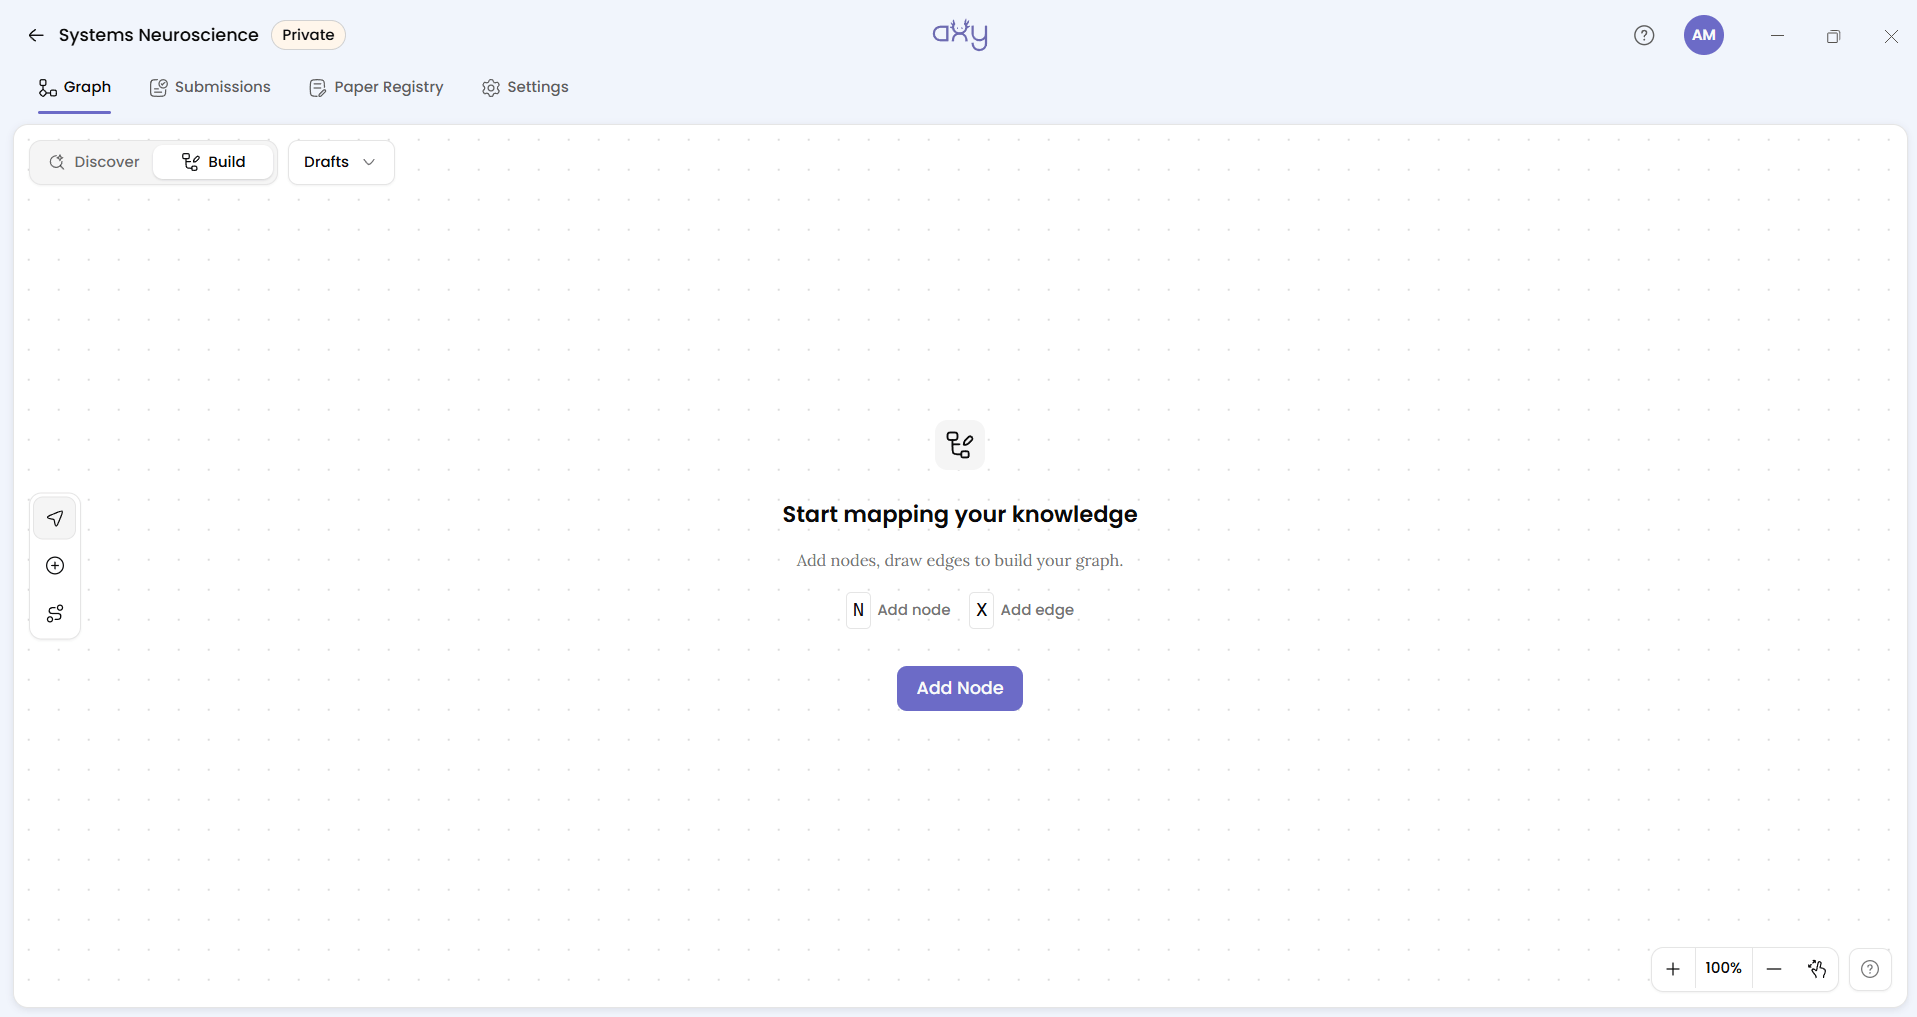
Open the knowledge graph you recently created and land on the Graph tab. This is where you’ll build and explore the knowledge inside your graph.
You’ll see four main tabs: Graph, Submissions, Paper Registry, Settings. For now, stay on Graph.
What you’re looking at is an empty graph canvas. Along the side you’ll find three tools to help you start building:
Select (Esc), Add node (N), and Add edge (X).
Every addition you make on the canvas gives shape to your ideas. This structured contribution can later be submitted, reviewed, and merged into the graph.
Start with a node
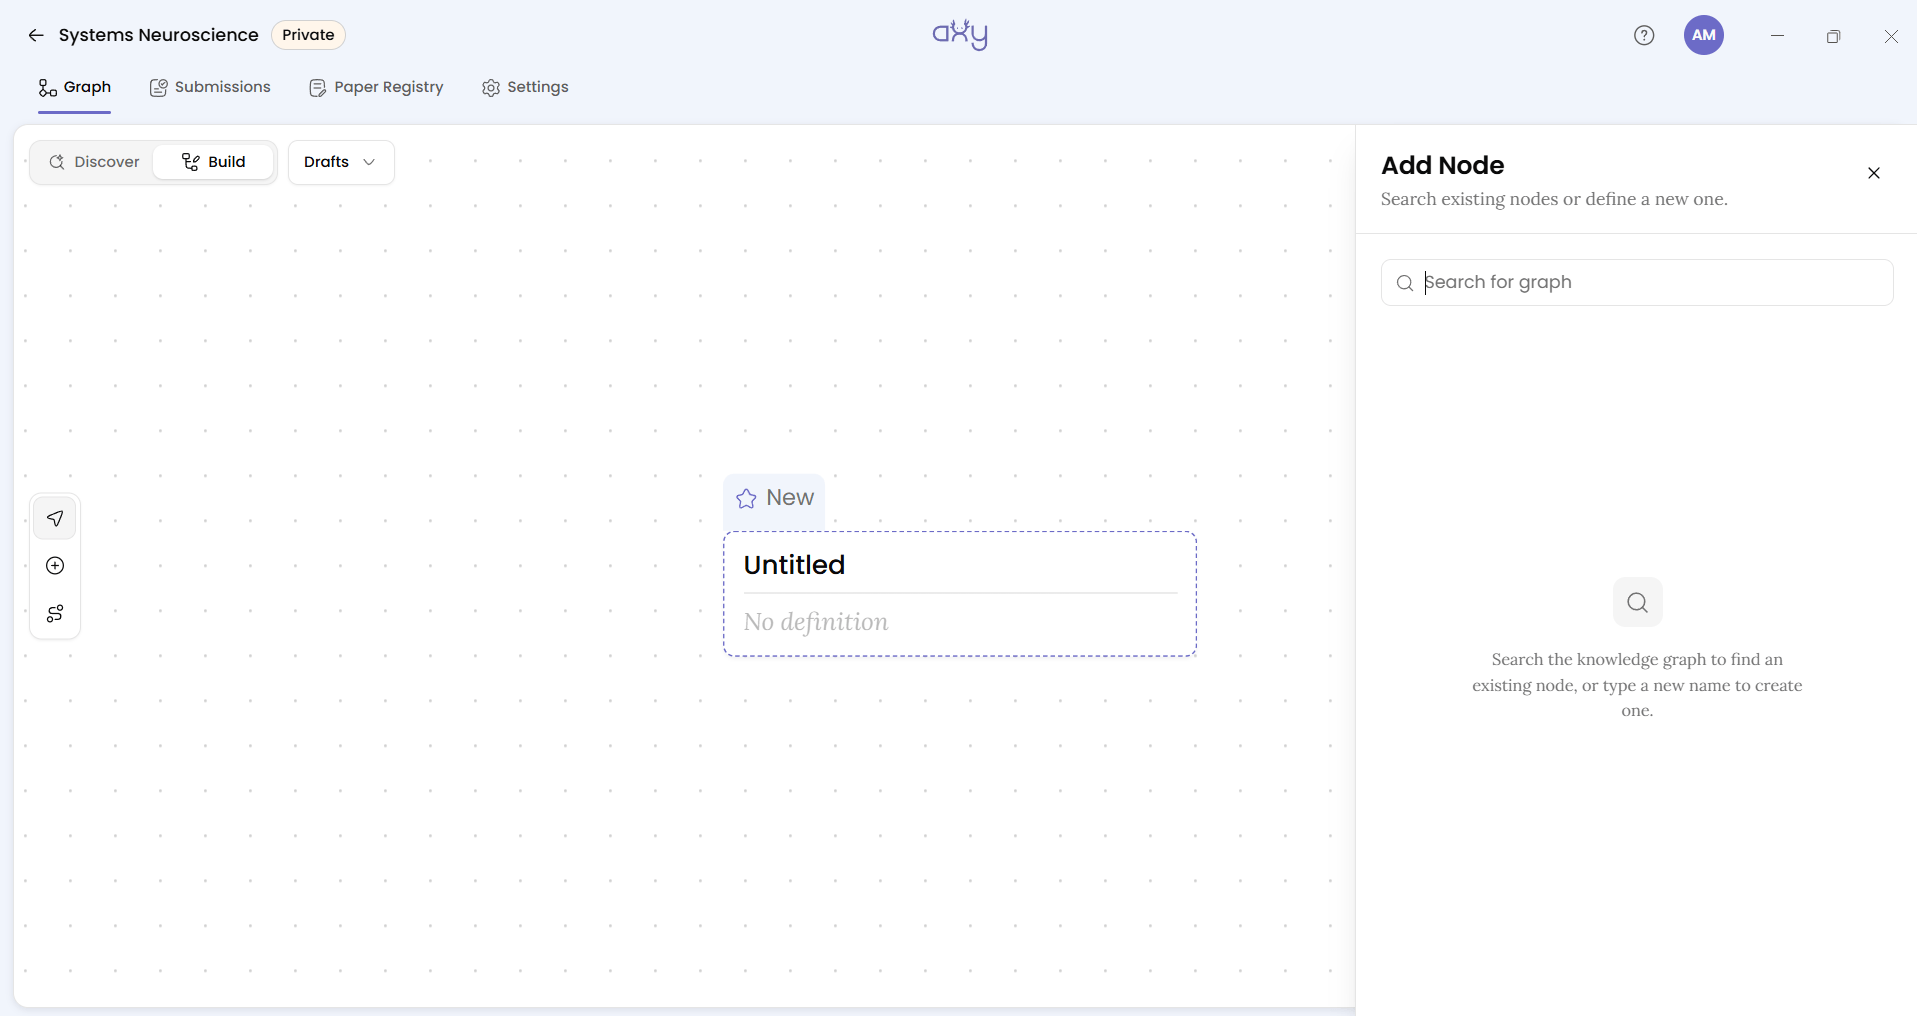
Pick Add node. A drawer opens on the side, titled Add Node, with a prompt: “Search existing nodes or define a new one.” That subtitle matters — a node isn’t always new. If the concept you want already exists somewhere in the graph, search for it here rather than making a duplicate. If it doesn’t, define it fresh.
Remember, a node is a concept in your field, not a random label. The next field asks for a Node Type — the same vocabulary that shaped your graph when you set it up in Settings. A Node Type can be a species, gene, disease, drug, protein, method, or research concept. Describe it in Description using terms your team already uses.
You also set the visual tone for the node with Colour and Icon. Definition and Confidence represent where the concept stands with your group. Aliases are alternate names — useful when a concept goes by more than one, like a species with both a scientific and a common name. Field tags capture every field the node belongs to, and you can attach relevant DOIs directly as evidence. A Custom Fields option covers any additional metadata that doesn’t fit an existing field.
While finishing, make sure the node still makes sense to your team when they come back to it in a few weeks.
Add a second node
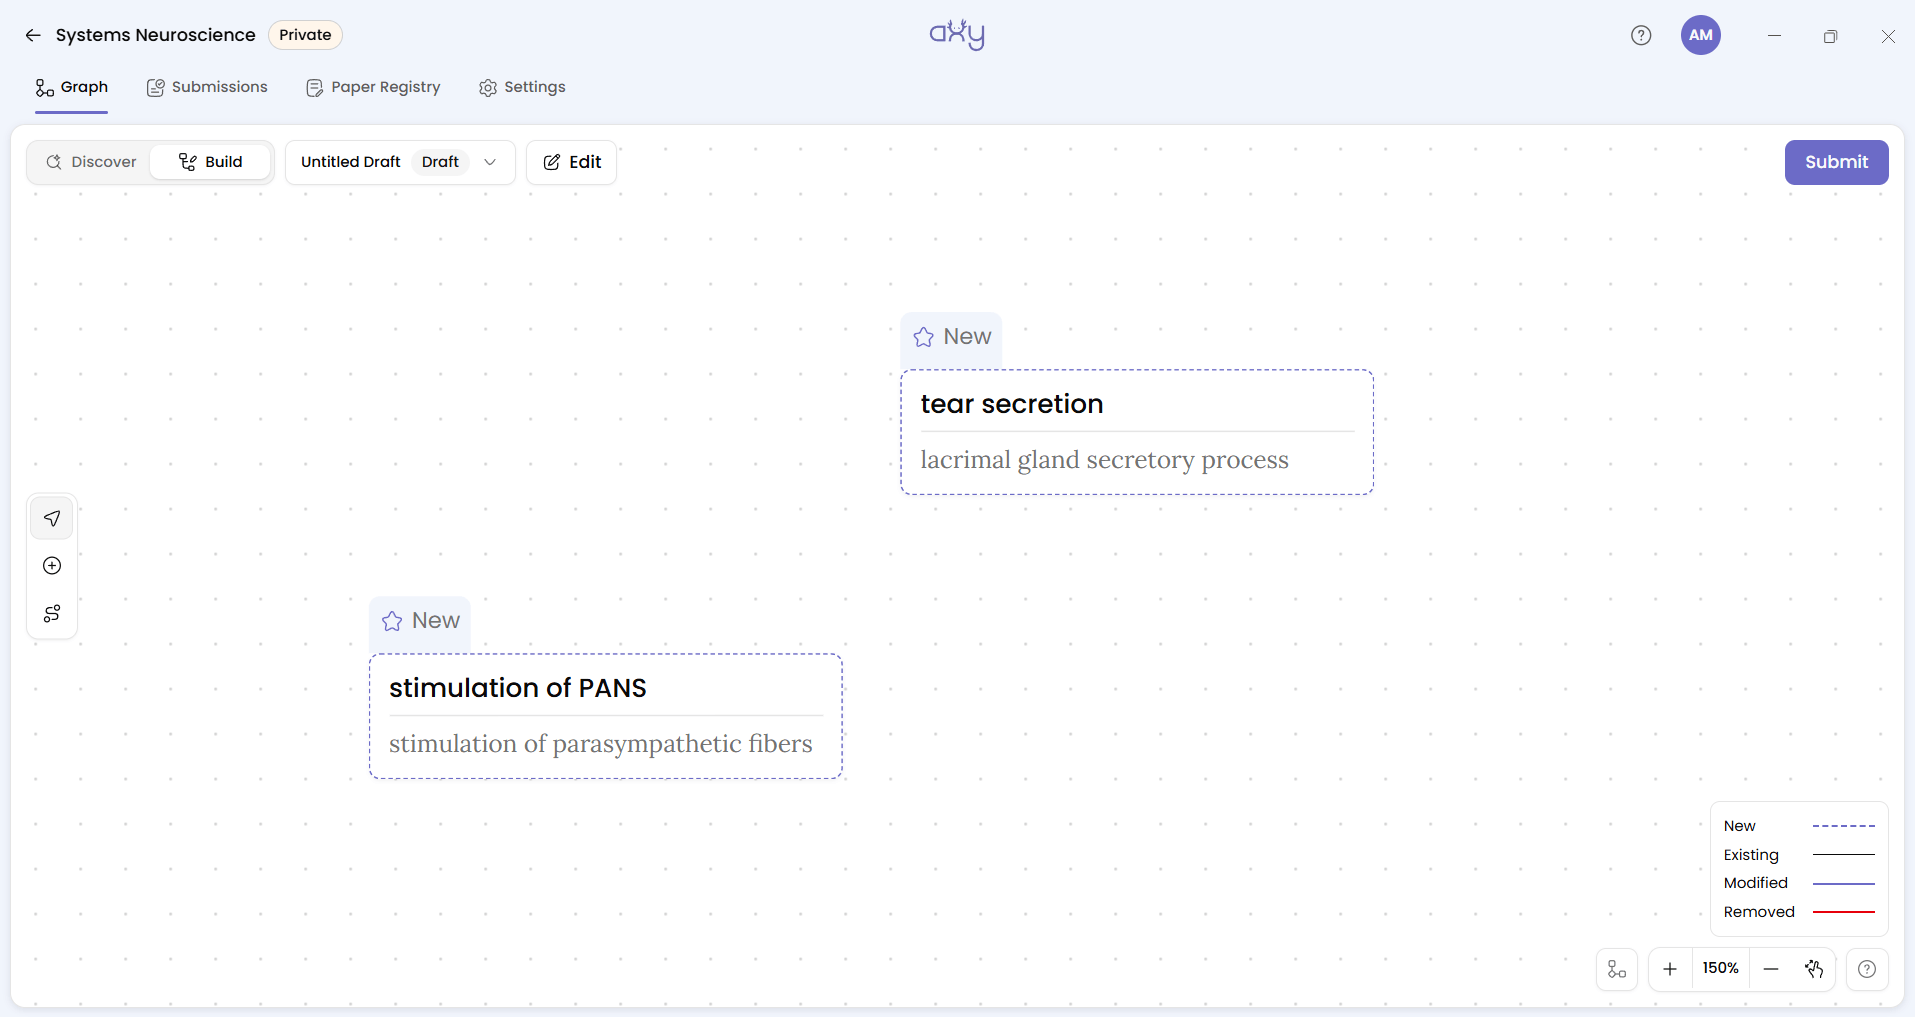
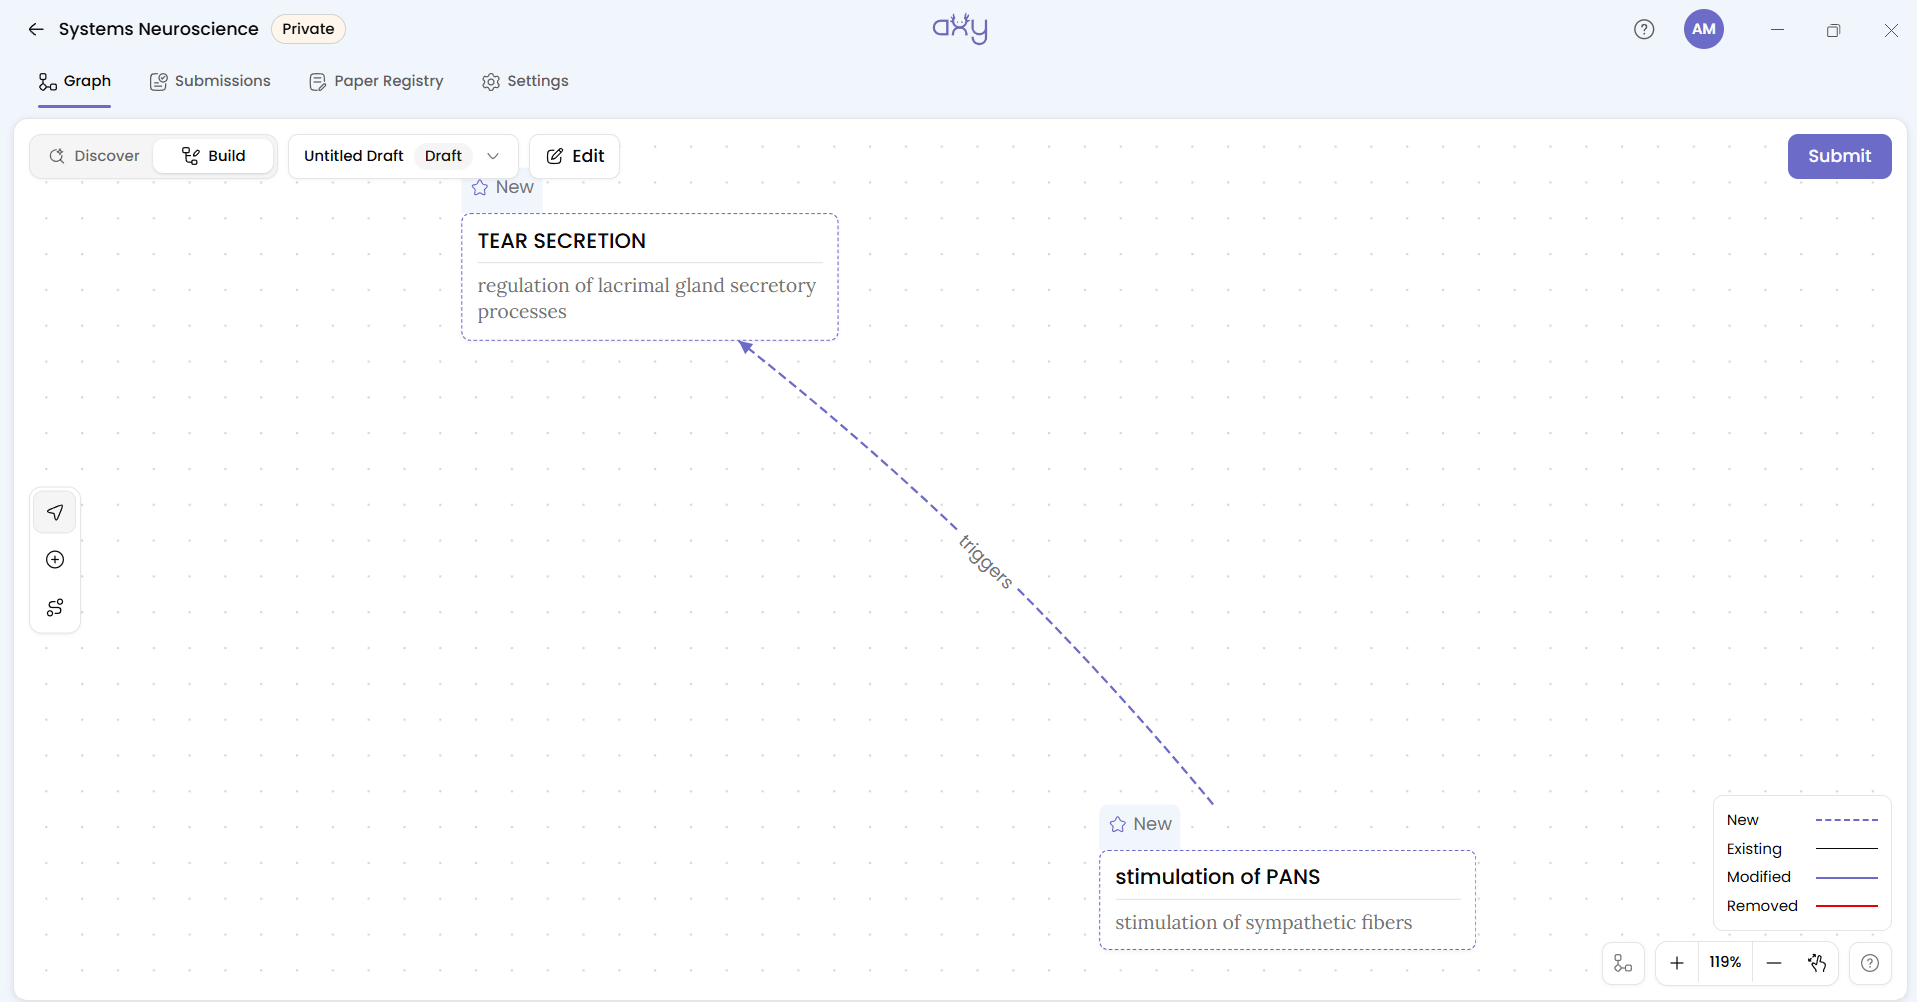
Repeat the same step to add a second node. But here’s the thing: two nodes sitting on the canvas isn’t a graph yet — it’s just two unrelated concepts. The value of a knowledge graph begins when you explain what connects them. That’s where edges come in.
Connect them with an edge
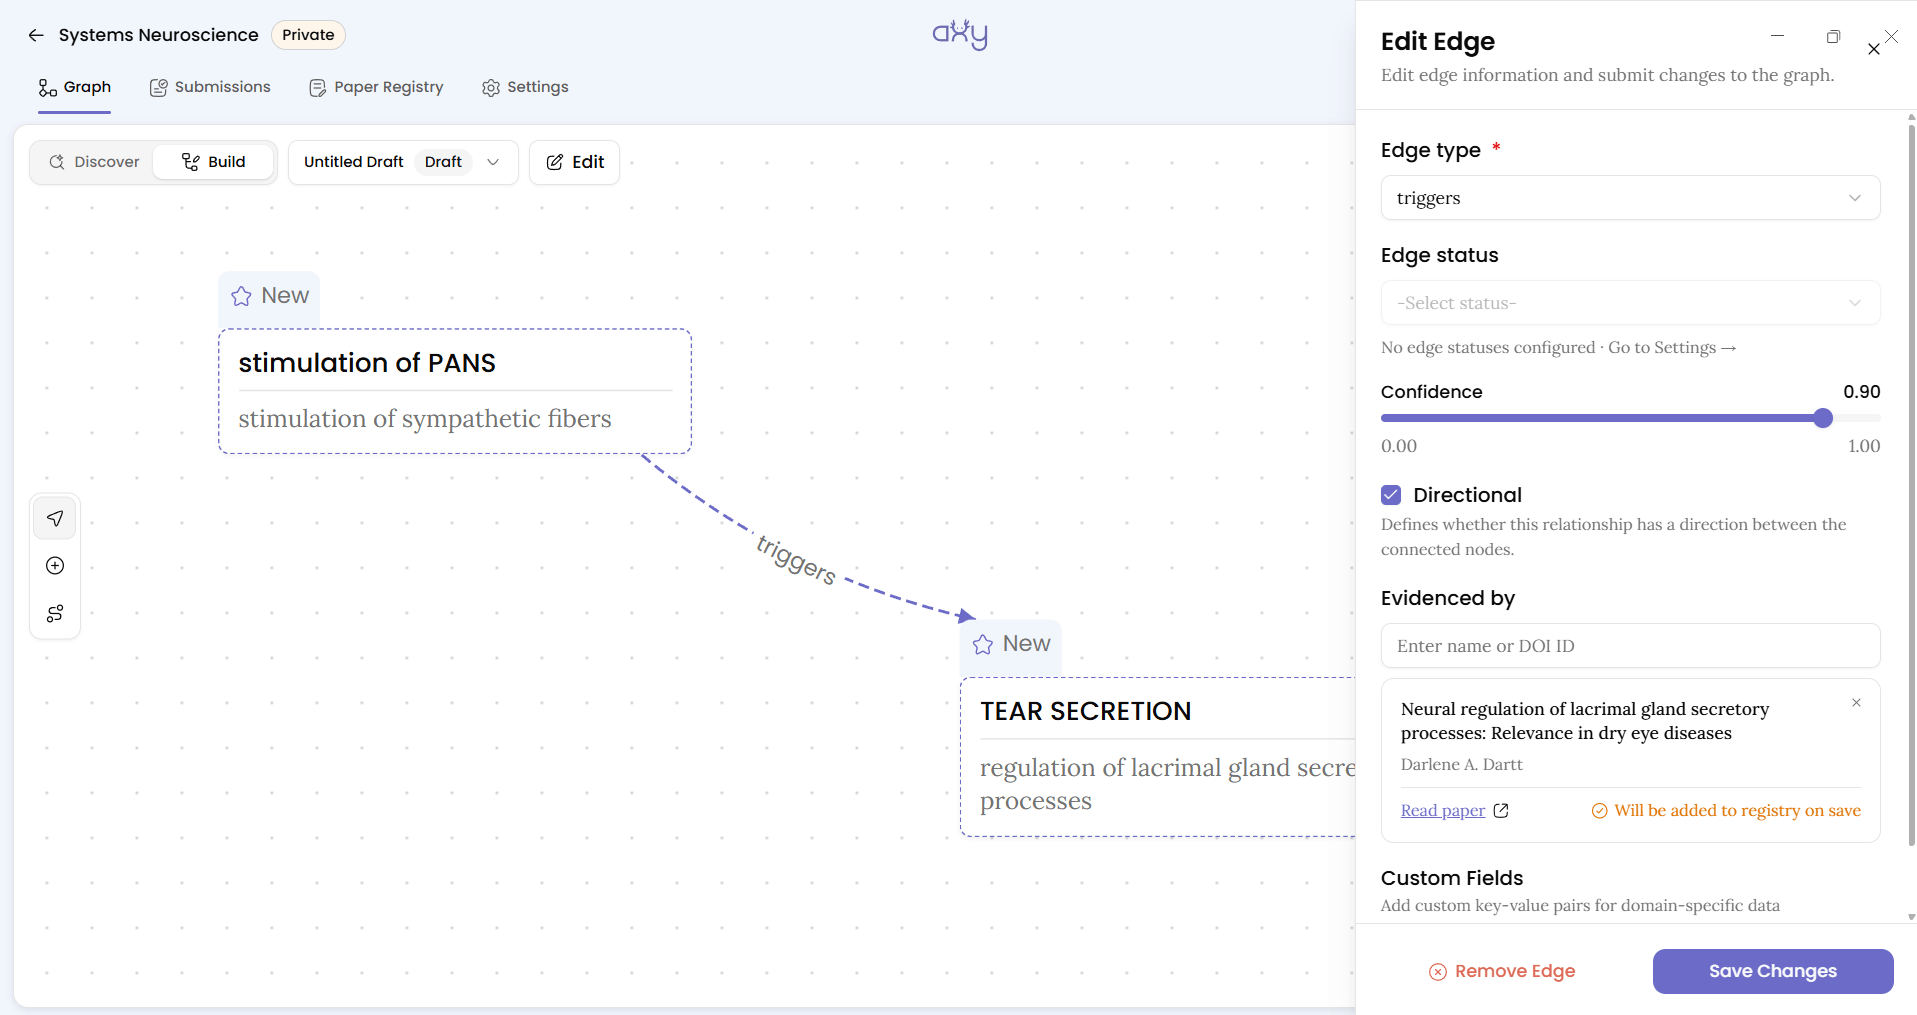
Pick Add edge and draw the connection between your two nodes. This opens a drawer titled Add Edge, subtitled “Define the relationship between the two nodes.” This is where you make a claim about how the concepts relate. It asks for a type (-Select type-), status (-Select status-), and Confidence (-Glide the %) — the same Edge Types and Edge Statuses vocabulary defined at setup in Settings. An edge type might describe whether one node treats, causes, regulates, inhibits, or interacts with the other. Edge Status and Confidence represent where that relationship stands in your team’s workflow. Add Custom Field covers anything beyond the default fields.
This is the step that turns a pair of nodes into an actual edge in the graph — not just related, but related in a specific way, with a specific level of confidence.
Attach the evidence
This is the part that separates a knowledge graph from a diagram.
Underneath the edge form is a field labelled Evidenced by. This is where you attach the paper where you read about the proposed relationship. Enter a DOI in the field (the placeholder reads “Enter name or DOI ID”), and Axy resolves it against CrossRef to pull the paper’s real metadata. That means the DOI needs to be real — a made-up or placeholder citation won’t resolve. Each one you add gets its own Remove DOI control, so you can attach more than one source or correct a mistake. This is what makes a claimed edge traceable instead of asserted.
Submit it
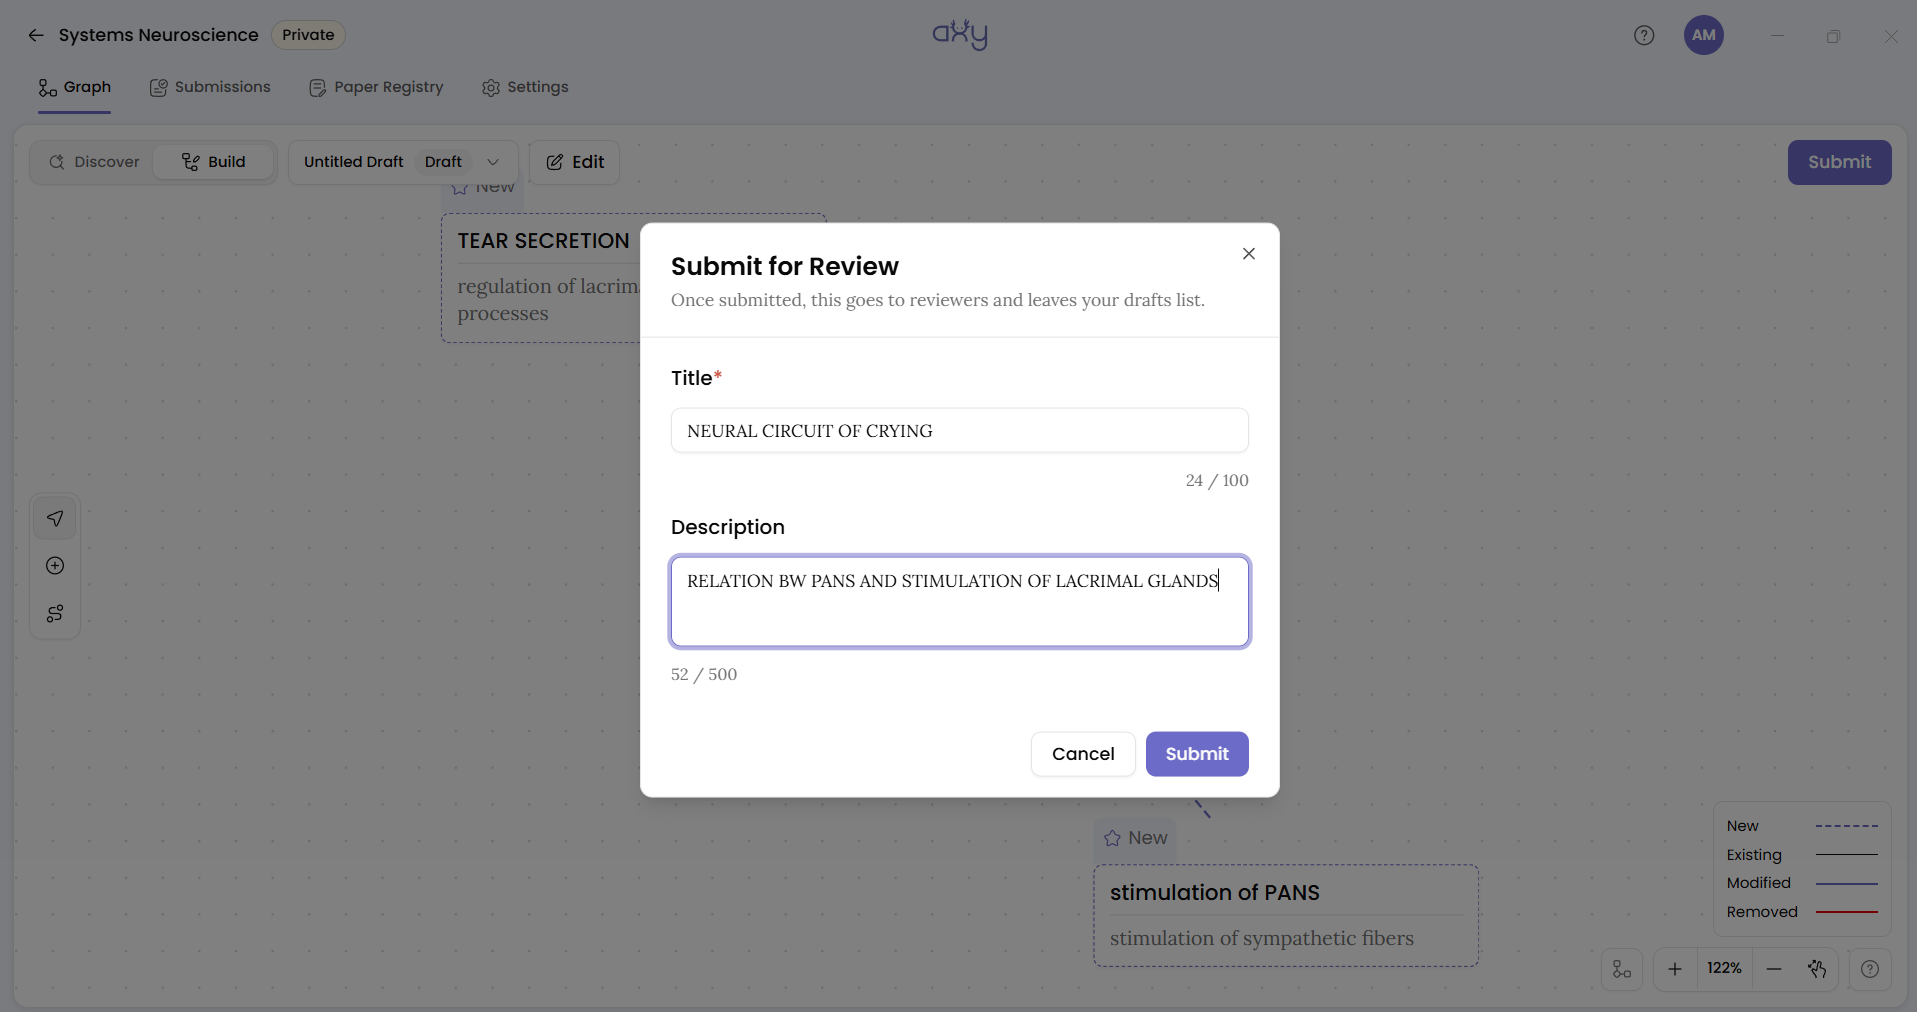
Up to this point, everything you’ve done exists only as a Draft in Axy — nothing has changed in the graph. Check the draft selector in the top bar and you’ll see it, along with a running list of your saved drafts if you need to come back to one. Draft and submitted are two different things, and it’s easy to think you’re finished the moment the canvas looks right. You’re not.
A draft lets you work on a proposed change before sending it into the graph’s review workflow — so don’t mistake a finished-looking canvas for a completed contribution.
The Submit button sits top-right of the canvas, disabled until there’s something pending to send. Click it, and you’ll see a toast: “Submitted for review.” That’s the moment your proposed nodes and edge leave your local draft and become a real submission against the graph, with a status of its own, separate from the canvas.
Nothing writes to the graph directly. Every change, yours included, goes through this step. That’s not friction for its own sake — it’s what keeps a shared graph a record of what was actually proposed and reviewed, rather than whatever the last person happened to drag onto the canvas.
Merge your own submission
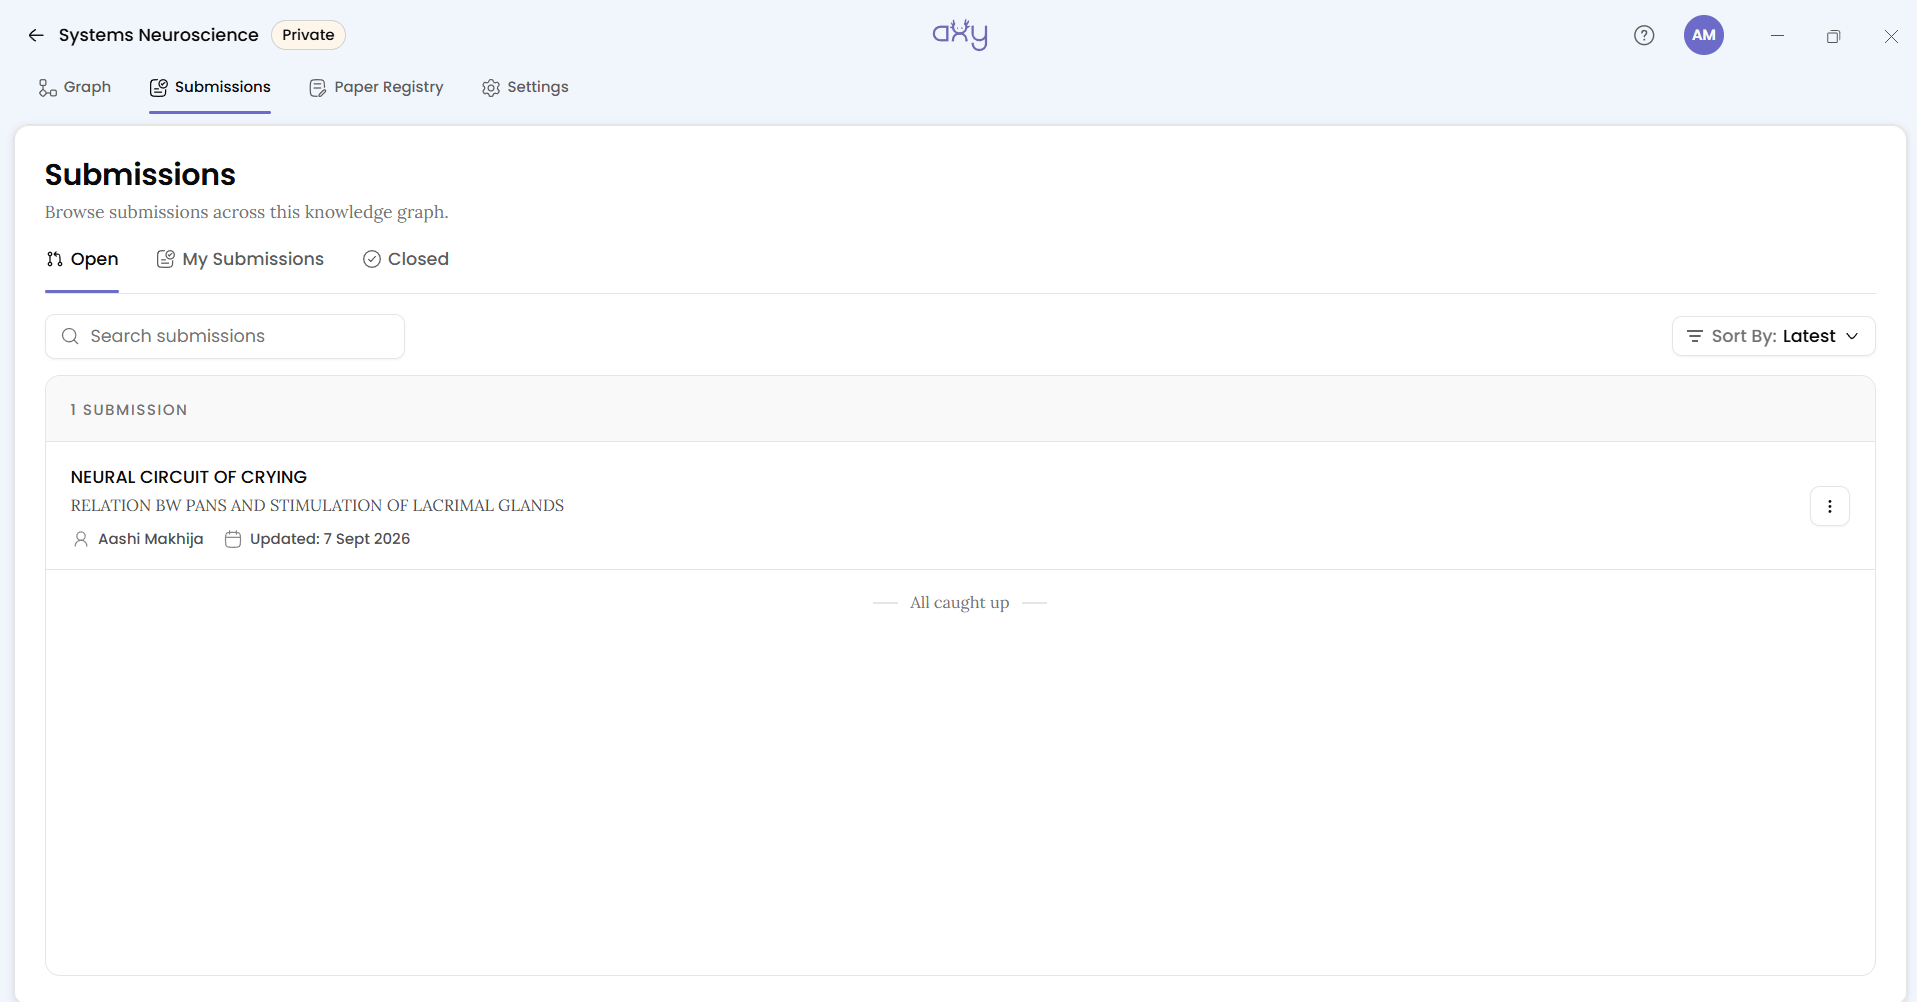
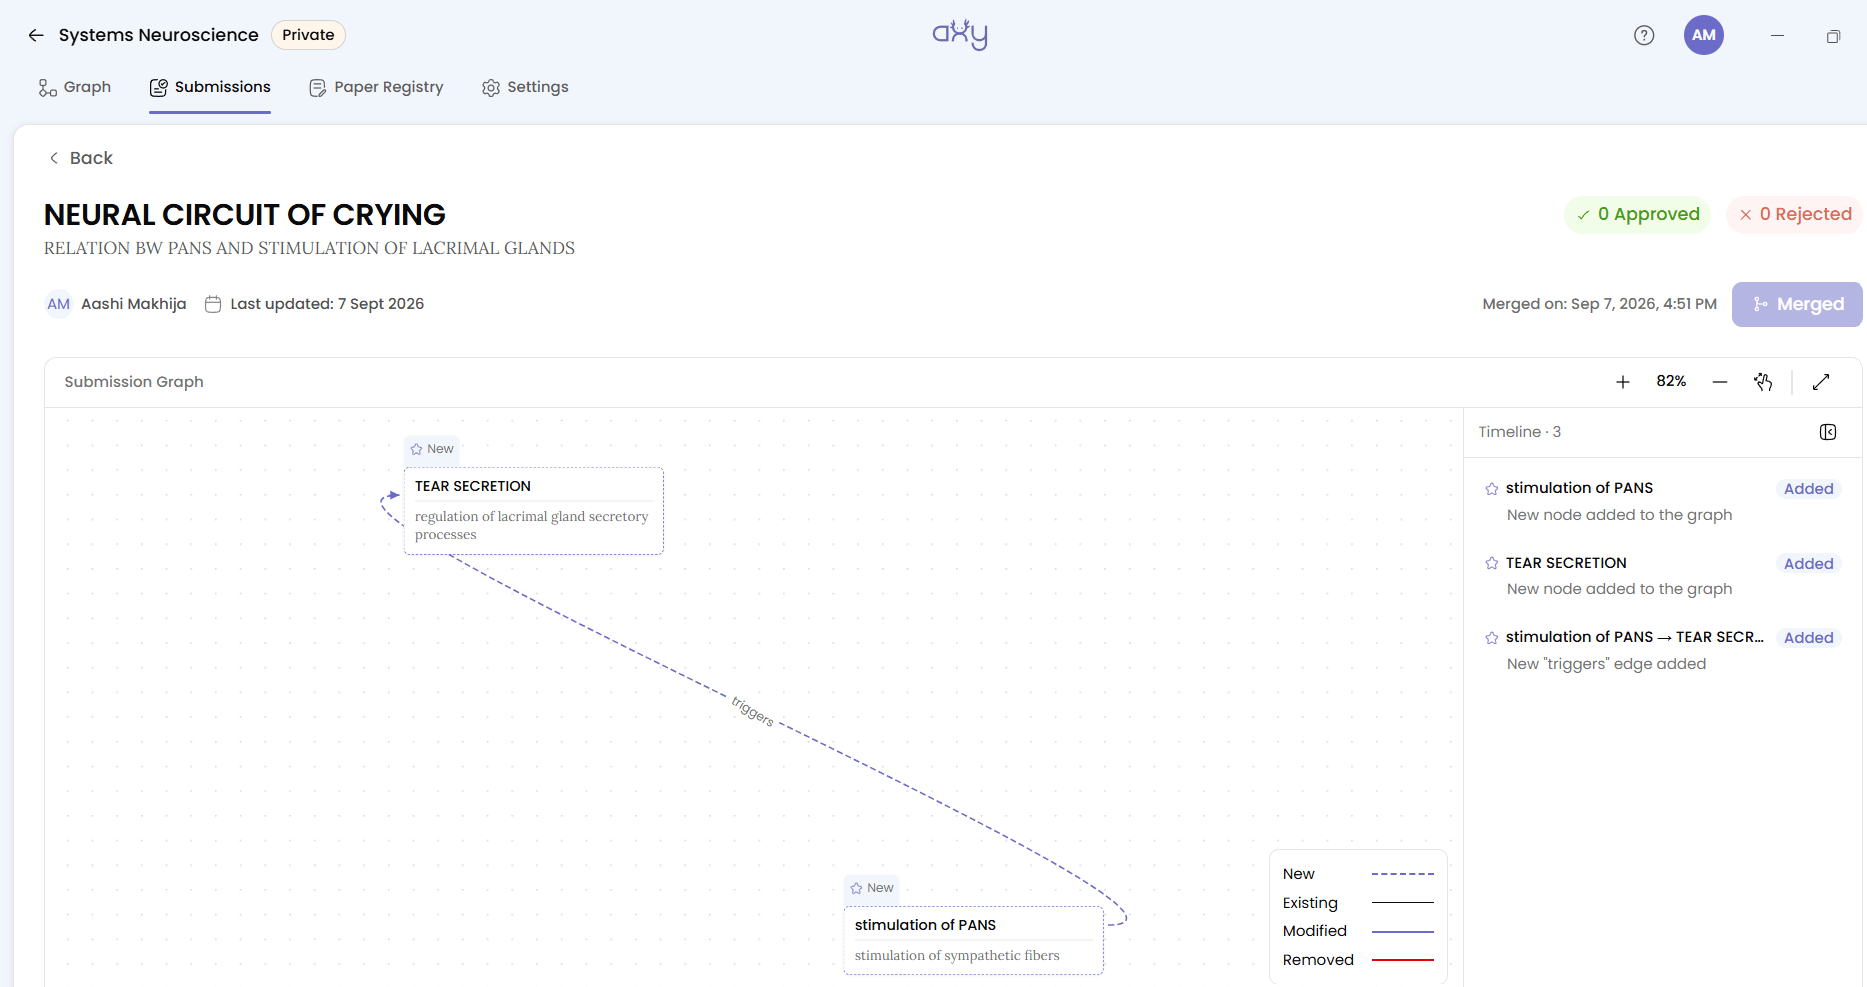
Head to the Submissions tab. This is where proposed changes live once submitted. You’ll find your contribution in the Open queue. Contributions split into two tabs, Open and Closed — the closed queue covers submissions that were closed out as well as ones that already merged. Your submission sits there, visible to anyone who can see the graph, until someone with the right access does something about it.
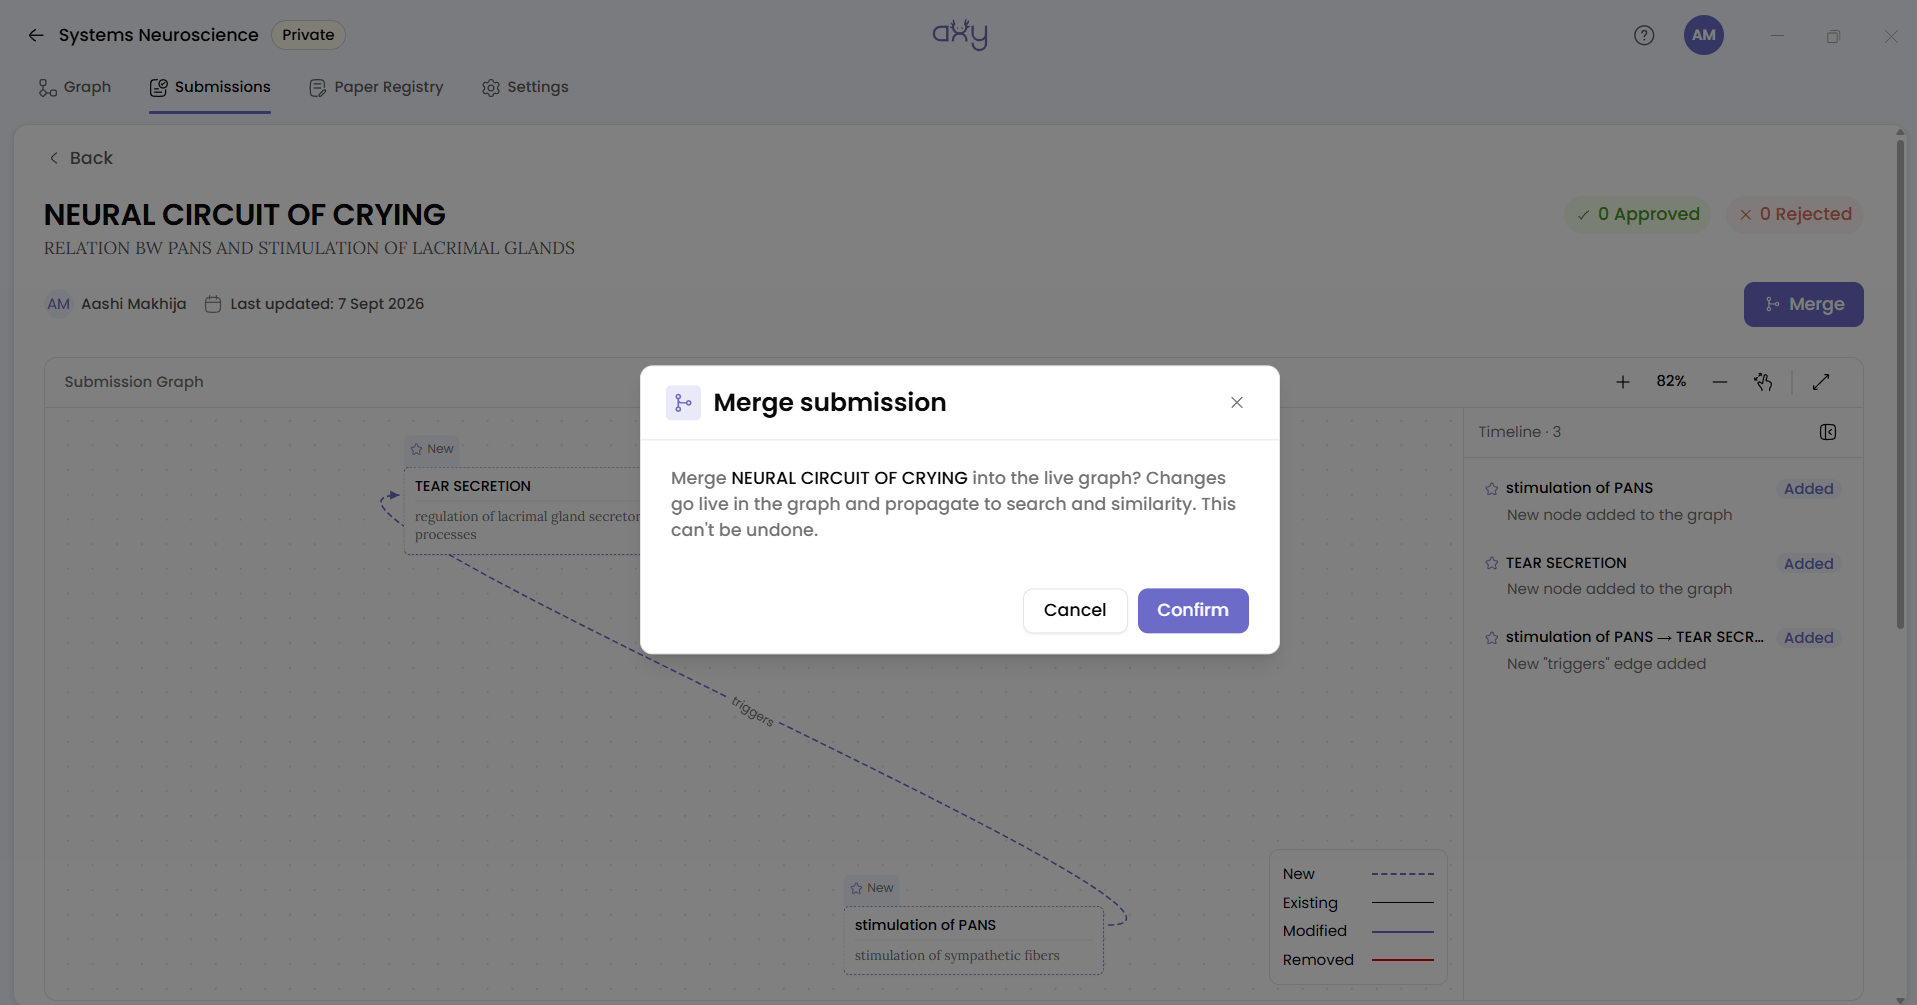
That someone is a graph admin, and merging is admin-gated. On your own graph, you’re the admin — which is exactly why this walkthrough uses your own graph rather than someone else’s. Open your submission and you’ll see a Merge button, shown only because you can merge here. Confirm through the Merge submission dialogue, and the button reads Merge Pending while it processes, then Merged once it lands. Go back to the canvas and your proposed node and edge are now part of the graph itself, not just a draft sitting beside it.
Occasionally a merge gets refused: if the graph changed underneath your submission since you made it, you’ll see a Merge Refused dialog telling you so. It’s rare on a graph only you’re working in, but worth knowing the message if you ever see it.
What’s next?
You’ve now been through the whole loop once: propose, back it with evidence, submit, merge. That’s the same loop everyone else contributing to this graph will go through. The only difference on someone else’s graph is that the merge decision isn’t yours to make.
If you’re setting this up for a team, the next thing worth understanding is what review looks like when the person merging isn’t the person who submitted.
'%3e%3cpath%20fill-rule='evenodd'%20clip-rule='evenodd'%20d='M120%20296L120%20280.035L120%20189.742L120%20120L356.293%20120H429.082L470%20120L470%20296L325.583%20296C298.92%20308.779%20268.624%20316%20236.5%20316C204.376%20316%20174.08%20308.779%20147.417%20296L120%20296Z'%20fill='%23B6C1EB'/%3e%3c/g%3e%3cg%20id='Ellipse%20142'%20filter='url(%23filter1_f_0_8)'%3e%3cpath%20fill-rule='evenodd'%20clip-rule='evenodd'%20d='M147.417%20296C137.774%20291.379%20128.607%20286.031%20120%20280.035L120%20189.742L120%20120L356.293%20120L429.082%20120C429.689%20125.758%20430%20131.595%20430%20137.5C430%20206.449%20387.622%20266.268%20325.584%20296C298.92%20308.779%20268.624%20316%20236.5%20316C204.376%20316%20174.08%20308.779%20147.417%20296Z'%20fill='%23FFFFE6'/%3e%3c/g%3e%3cg%20id='Ellipse%20143'%20filter='url(%23filter2_f_0_8)'%3e%3cpath%20fill-rule='evenodd'%20clip-rule='evenodd'%20d='M120%20189.742C141.632%20225.693%20183.01%20250%20230.5%20250C300.364%20250%20357%20197.394%20357%20132.5C357%20128.278%20356.76%20124.107%20356.293%20120L120%20120L120%20189.742Z'%20fill='white'/%3e%3c/g%3e%3c/g%3e%3cdefs%3e%3cfilter%20id='filter0_f_0_8'%20x='-6.38111e-08'%20y='4.01978e-08'%20width='590'%20height='436'%20filterUnits='userSpaceOnUse'%20color-interpolation-filters='sRGB'%3e%3cfeFlood%20flood-opacity='0'%20result='BackgroundImageFix'/%3e%3cfeBlend%20mode='normal'%20in='SourceGraphic'%20in2='BackgroundImageFix'%20result='shape'/%3e%3cfeGaussianBlur%20stdDeviation='60'%20result='effect1_foregroundBlur_0_8'/%3e%3c/filter%3e%3cfilter%20id='filter1_f_0_8'%20x='20'%20y='20.0001'%20width='510'%20height='396'%20filterUnits='userSpaceOnUse'%20color-interpolation-filters='sRGB'%3e%3cfeFlood%20flood-opacity='0'%20result='BackgroundImageFix'/%3e%3cfeBlend%20mode='normal'%20in='SourceGraphic'%20in2='BackgroundImageFix'%20result='shape'/%3e%3cfeGaussianBlur%20stdDeviation='50'%20result='effect1_foregroundBlur_0_8'/%3e%3c/filter%3e%3cfilter%20id='filter2_f_0_8'%20x='20'%20y='20.0002'%20width='437'%20height='330'%20filterUnits='userSpaceOnUse'%20color-interpolation-filters='sRGB'%3e%3cfeFlood%20flood-opacity='0'%20result='BackgroundImageFix'/%3e%3cfeBlend%20mode='normal'%20in='SourceGraphic'%20in2='BackgroundImageFix'%20result='shape'/%3e%3cfeGaussianBlur%20stdDeviation='50'%20result='effect1_foregroundBlur_0_8'/%3e%3c/filter%3e%3c/defs%3e%3c/svg%3e)


